Saturday, May 31, 2014

How does it get from this balance sheet to that one?


Steve Roth comments:
And there's no such thing as "money in circulation" at any given moment. That pipe going out of and back into the money bathtub is instantaneous.

It's either in this account, or it's in that account. It's never in between, or in transmission.

There is not money out there on the highway as there are cars.

Money doesn't actually "move." There are only changes in the tallies on balance sheets. (Dollar bills are just physical tokens representing balance-sheet tallies. [See R Wray on the origins and nature of money.])

It's on this balance sheet, or it's on that balance sheet.

"It's on this balance sheet, or it's on that balance sheet," Steve says. But how does it get from this balance sheet to that one? At last we have hit upon the difference between accounting and economics:

Accounting deals with balance sheets.
Economics deals with forces that change balance sheets.


Adam Smith comments:

The gold and silver which can properly be considered as accumulated or stored up in any country may be distinguished into three parts: first, the circulating money; secondly, the plate of private families; and, last of all, the money which may have been collected by many years' parsimony, and laid up in the treasury of the prince.

There is money we plan to spend, and money we plan not to spend. The former is in circulation; the latter is savings. It's that simple. The Federal Reserve defines this clearly on the "notes" tab for the M1SL series:

M1 includes funds that are readily accessible for spending.

The M1 number, the funds that are readily accessible for spending, is probably a little more than the amount of money people plan to spend, because everybody wants to save a dollar. The spending-money I have, that gets me through the week, I don't want to be broke on payday, I want a few bucks left over. Anyway...

Suppose we take total outstanding debt as a measure of total outstanding money. (This is somewhat like Steve Roth saying that the total value of assets is money.) Accumulated debt is a measure of money that exists, somewhere, that borrowers are still paying interest on because they didn't pay off the debt yet, they didn't extinguish the money.

So we can take the funds available for spending -- FRED's M1SL -- and compare that number to accumulated debt as a proxy for the total amount of money that exists, that people are paying interest to maintain in existence, FRED's TCMDO:

Graph #1: M1 -- the money we use to pay off debt -- per dollar of debt.
In 1960 there was about 20 cents of circulating money (that is, the money that becomes income) for each dollar of accumulated debt. That number was down below ten cents by 1980. Today, there is only about four cents of circulating money for every dollar of debt. Four cents. No wonder debt seems a burden today.

Every dollar of that debt corresponds to a dollar of money that was newly created when the debt was created. The debt still exists. So where is the other 96 cents?

A lot of it went into savings and other financial assets, and out of circulation.

There's a big focus these days on income inequality. Here's the root of the problem: Some people are earning interest and others are paying interest on more and more and more of the money in our economy. It's a mad house! A mad house!

The graph shows there's only four cents left, with which to pay the interest and principal on a dollar of debt and still do everything else we need money for.

And paying off a dollar of debt reduces that four cents by a dollar.
Friday, May 30, 2014

Red Tips


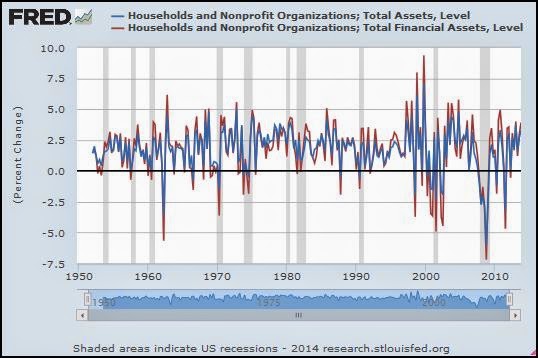
This graph shows percent change from the previous quarter of household assets, with blue for total assets, and red for financial assets:

Graph #1: Percent Change in Total Assets (blue) and Total Financial Assets (red)
Quarterly Data
Notice the red tips on all the high and low points. Tells me that the change in financial assets is consistently more volatile than the change in total assets.

Assuming "total" assets is the sum of financial and non-financial assets, the graph tells me that the difference in volatility would be even more if we compared financial assets to non-financial assets.

To do that, look at financial assets and (total assets less financial assets):

Change in Total Financial Assets (red; same as Graph #1) and Total Non-Financial Assets (blue)
The difference in volatility is much greater in this graph. Non-financial assets, consistently, are far more stable than financial assets.

Thursday, May 29, 2014

Financial Cycles


You never know what's gonna turn up.

Responding to Steve Roth, I poked and prodded "assets" just a bit at FRED. This one didn't allow me to make any bold claims, so I didn't use it:

Graph #1: Total Financial Assets as a Percent of Total Assets, among Households
But thinking about it later, I remembered it as a cyclic pattern. The repeating ups and downs. There was a sudden slight gasp, and I said I wonder if that matches Borio's financial cycle.

I pulled Borio's graph from an old post:

Graph #2 (Borio's): The Business Cycle (red) and the Financial Cycle (blue)
As it happens, Borio's graph has a see-through background. Made my day. I overlaid his graph on the other, then scaled it down and moved it to make the dates match and the recession bars line up. I got tips from stackoverflow.com for both overlaying and scaling. I hope it works on everybody's device.

Borio's graph has a gray background, so it's easy to find on the FRED graph. The numbers are tiny and hard to read, but you can see the recession bars okay, and you can refer back to Graph #2 for the numbers. Here's the FRED graph with the Borio overlay:

bottom image
top image
Graph #3: The Combo Graph
Nah, the blue lines don't show a similar pattern. Too bad. But I noticed something: There is a definite downtrend during the Great Inflation, when financial asset values eroded.

Before the Great Inflation, when the economy was good, there was an uptrend. And toward the end, during the bubbles, there were uptrends... Maybe not during the bubbles. That last uptrend runs from 2006 to 2011, like after the bubble and all through the crisis. Huh.

The ratio of financial assets to total assets doesn't seem related to economic performance. I find that surprising. No conclusions yet.

Wednesday, May 28, 2014

Squeezing a balloon


On 21 May, at Asymptosis and at Angry Bear, Steve Roth wrote:
I’ve bruited the notion in the past that “money” should be technically defined, as a term of art, as “the exchange value embodied in financial assets.”

In the past, in other words, Steve has spread the idea that the definition of money should be such-and-so (as given in the excerpt above).

Maybe he has spread that idea in the past, and regrets it now. Or maybe he is continuing to spread that idea in his post of the 21st. I assume the latter, but let's leave the door open.

Roth:
In this definition, counterintuitively relative to the vernacular, dollar bills aren’t money. They’re embodiments of money, as are checking-account balances, stocks, bonds, etc. etc...

I think that's supposed to be a clarification. The list of financial assets creates an aura of familiarity. But forget the list, and focus on the statement: In this definition... dollar bills aren’t money. They’re embodiments of money...

That's his second use of the word "embody" -- and we're only three sentences in to the post.


So Roth says dollar bills aren't money; they're just a tangible or visible form of money... or the representation or expression of money. Dollar bills and all the other kinds of financial assets are not money, but are representations of money.

More words, less meaning.

Skip a sentence, and resume with the next paragraph:
If this definition is safe, then the stock of money ... equals the total value of financial assets. Forget the endless wrangling about monetary base, M1, M2, divisias, and all that. Add up the value of all financial assets, and that’s the money stock.

Another list. Forget the list. Roth is saying that financial assets are the money stock. Or possibly, that the value of all those financial assets is the money stock.

In a comment on mine, Roth writes:
One thing I'm saying is that financial assets=money is wrong. You keep saying I'm saying that, and I'm not.

So I guess he means it's the value of all those financial assets that is the money stock, not the assets. But money is not value, and value is not money.


It's like squeezing a balloon. For a moment it feels like you've got something. But squeeze a little tighter, and there's nothing there.

How to Recognize Pseudoscience: Parsimony (Occam's Razor)


From paranormal-phenomena.info:

Does the theory require you to discard any established laws of physics or other science? If so, is the new theory really more robust than the old?

Remember, the theory which is simplest and relies on the least number of unproven assumptions is most likely to be correct.

That's not bad.

Related links:

How to Detect Junk Science

Carl Sagan’s Bullshit Detection Kit

Tuesday, May 27, 2014

Income ≠ Money ≠ Value ≠ Wealth


Steve Roth of 24 May:

The key (and I think hugely simplifying and clarifying) distinction:

money [is to] financial assets [as] energy [is to] barrels of oil.

In the vernacular we speak of oil as “energy,” but we know that they’re conceptually distinct. The energy is embodied in the oil. Just as it’s embodied in a rock at the top of a hill.

So... we speak of financial assets as "money," but we know they're conceptually distinct? We know they're different? Yeah, I agree with that. Most financial assets are NOT money. But that's not what Roth wanted to say:

Pieces of currency are just financial assets (legal claims, or credits) that have particular characteristics, properties. As do barrels of oil and rocks on top of hills. We’ve always called those particular types of financial assets “money,” and therein is rooted much of the confusion and miscommunication we suffer under, IMNSHO.

I friggin hate metaphors. Pieces of currency are just financial assets with the particular characteristic that we use them for money. If you like: All money is financial assets, but not all financial assets are money. That's fine, I guess. But this is not fine:

Add up the value of all financial assets, and that’s the money stock.

That is just plain wrong.


Roth of 21 May:

“money” should be technically defined, as a term of art, as “the exchange value embodied in financial assets.”

I replied:

To me, money is the medium of exchange, not the exchange value.

You can see I was focusing on the word "exchange". That could have been a mistake. Let me re-arrange Steve's definition of money just a little:

Money should be defined as the value embodied in financial assets, value that can be used for exchange.

That's a little less objectionable, maybe. But the thing about money that makes it special is that it is used for exchange. Money is the particular "embodiment" of value that is useful for exchange. And it's not that money "is" value, but that money "has" value.

"Value" is in the eye of the beholder. Things have value because we value them. Money has value because we value it, and especially because most of us value it similarly (so that it is widely useful for exchange). But value is one thing, and money another.


There's value in money, and there's value in other financial assets. Money is the particular financial assets that is generally used for exchange.

The trouble with thinking of all financial assets as money is that most financial assets are not generally accepted in exchange. You have to convert your financial assets into an exchangeable form before you can spend them: You have to convert them into money. Steve Roth says the same:

People can exchange various financial assets for currency-like financial assets when they need to buy real stuff, but that’s largely mechanical; its macroeconomic effects are trivial.

He says you have to convert your asset into money before you can spend it. Then he tries to minimize the significance of this with sweeping generalities that happen to be wrong. Remember the deleveraging a few years back? Everybody wanted to convert their financial assets into cash. The demand for financial assets fell sharply. And what happened? Asset values crashed. There was nothing "trivial" about that.

Yes of course, it was a unique situation. It was a situation that showed most clearly that not all financial assets are money.


Roth of the 24th:

I hear this kind of thing all the time. e.g. “Health-care spending is taking all that money out of the economy.” As you would say, “Nonsense!” ;-)

I remember that same complaint used against the space program, years back. The catch phrase was that they were throwing money into space. That was obviously incorrect; the money stayed on planet Earth. But the money was most certainly being thrown into circulation by the space program. It was not allowed to sit idle in anybody's "bathtub".

You can’t “take a dollar out” of the bathtub (except by paying off loans to the financial sector, paying taxes to the federal government, or reducing the equity allocation in your portfolio hence driving down stock prices).

If the bathtub is planet Earth? No, we don't take money off-planet. There's nobody out there to sell you things or accept payment. Not yet, anyway. But if the bathtub is the economy? Then yes, we can take dollars out of the "bathtub".

The economy is transaction. Failing to spend takes money out of the economy, just the same when you fail to spend as when the Federal Reserve fails to spend. Money-not-spent is money removed from the spending stream. Hoarding will do it, and if loans create deposits -- and if nothing happens with the money in savings, as some people say -- then saving is just the same as hoarding.

You can, however, reduce or increase the turnover of your stock of money in a given period. You can “hoard” or spend your money. Not-spending is indeed taking a dollar “out of the flow” (relative to the counterfactual of spending it) — reducing velocity.

Not sure about "reducing velocity". A dollar removed from the spending stream affects both GDP and the quantity of money in motion. Affects both the numerator and denominator of the velocity ratio. So I can't say what happens to velocity so easily.

Roth insists on keeping money all in one lump -- one "stock of money" -- which has a single turnover rate that you can change by spending more or spending less. But economists define several types of money: "monetary base, M1, M2, divisias, and all that" as Roth observes. He wants to sweep "all that" confusion away, and come up with something new. That's the wrong way to do economics.

Yet we seem to agree. Roth says: Not-spending is indeed taking a dollar “out of the flow”. Then he tramples the obvious:

But in aggregate, not-spending doesn’t “tuck it away” any more than spending it does. If you spend it, it just ends up tucked away in somebody else’s account.

That's not right. If I spend it, it ends up as somebody else's income. Income is money in circulation. You know, cash flow. Then, having received the income, they get to decide whether they'll be spending that money or saving it. If they decide not to spend it, they are tucking it away for later. But the economy is not just "having money". The economy is spending. If the money doesn't move, there is no economy.

Spending vs. not-spending doesn’t change the amount of money in the bathtub.

"Spending" is clean water, flowing into your bathtub. "Saving" is the soapy, wet, gray pool of filth you relax in.

Monday, May 26, 2014

Piketty lovers must read


At Reddit: I think I figured out where that weird "+2" is coming from in "Capital", by besttrousers.

Let's Go Surfing Now


From Keynes's biographer Robert Skidelsky, this:

The classical economists of the nineteenth century looked forward to what they called a “stationary state,” when, in the words of John Stuart Mill, the life of “struggling to get on…trampling, crushing, elbowing, and treading on each other’s heels” would no longer be needed.

Interesting. The stationary state of the classical economists is the same as Professor Commons' period of stabilization::
Professor Commons... distinguishes three epochs, three economic orders, upon the third of which we are entering.

The first is the Era of Scarcity... In such a period, 'there is the minimum of individual liberty and the maximum of communistic, feudalistic, or governmental control...'" This was, with brief intervals in exceptional cases, the normal economic state of the world up to (say) the fifteenth or sixteenth century.

Next comes the Era of Abundance. 'In a period of extreme abundance there is the maximum of individual liberty...'" During the seventeenth and eighteenth centuries we fought our way out of the bondage of Scarcity into the free air of Abundance, and in the nineteenth century this epoch culminated gloriously in the victories of laissez-faire and historic Liberalism. It is not surprising or discreditable that the veterans of the party cast backward glances on that easier age.

But we are now entering on a third era, which Professor Commons calls the period of Stabilisation... In this period, he says, 'there is a diminution of individual liberty....

"It is not surprising or discreditable that the veterans of the party cast backward glances on that easier age." One still sees this among conservatives today.


I stand by what I said four years ago:

Scarcity... Abundance... and Stabilization. If there are business cycles -- and cycles within cycles -- then there is a Cycle of Civilization. The Dark Age is a Great Depression. The Era of Scarcity is the long, slow, painful recovery. The Era of Abundance is the boom, the peak of the cycle. And the Era of Stabilization is the Professor's optimistic misnomer for crisis-and-decline.

If we're good, if we choose wisely, if we don't proceed blindly, then there is a chance we can ride the downslope of that economic wave like a surfer.

The cycle of civilization is a cycle in the dispersion and concentration of wealth. The inequality that troubles Piketty and the Pope is evidence of that cycle. The growth and decay of cities and nation-states is evidence of that cycle. The saucer-shaped pattern traced by interest rates during the course of ancient civilizations is evidence of that cycle.

Stabilizing the decline of the great cycle is a simple matter of stabilizing the distribution of wealth and income at optimum -- at levels that best drive growth and maximize individual liberty under capitalism.

Basically, in order to give the conservatives what they want, we have to give the liberals what they want.

Ain't it sweet?

Sunday, May 25, 2014

"as bogus as a three-dollar bill"


That's not the expression, you know.


I check my blogger stats often. The main thing is always more pageviews. Can't help it. But sometimes I look at what posts people have been reading. Sometimes I re-read one of those. That's how I came back to Indirection, from three years ago. Short post, but some good comments. And a link or two to Why the U.S. GDP number may be as bogus as a three-dollar bill at The Globe and Mail:

In 10 days, Washington will release its revised estimate of first-quarter economic growth...

Economists will issue a variety of learned opinions about what it all means...

What most of them will not be saying is that the GDP figure is essentially meaningless.

I have to go just briefly off topic. Where does this stupid fetish for the wrongness of GDP come from? Yes, yes, the economy is all screwed up. No, no, GDP doesn't count the hours your mama spent hanging the wash out to dry. Maybe, maybe such things should be counted in some alternate-universe replacement for GDP. But for now let's stop with the drivel and focus on the problems in our economy. It wasn't the failure to count your mama's laundry that made the economy go bad.

Okay. So Brian Milner, the author of the Globe and Mail article, writes:

Many of us instinctively distrust some (okay, a lot) of what governments tell us... But tell us GDP is growing at a faster clip than forecast, and we erupt into loud cheers.

But what if the number turns out be fake? That's the provocative question posed by renowned U.S. money manager Rob Arnott, who makes a convincing argument that what passes for growth in the U.S. and a bunch of other deficit-ridden economies is less than it seems.

Fake? Not real? What?

"It may be for real or it may be phony, based on increases in deficit spending," Mr. Arnott says of the latest European numbers. But while he's unsure of euro-zone growth in a new age of austerity, the chairman of California-based Research Affiliates is absolutely certain that next week's revised U.S. GDP number will be as bogus as a three-dollar bill. That's because it will not take into account how much of the American expansion stems from the government's deficit-spending binge.

Oh. Mr. Arnott says the increase in GDP is fake because the government upped its spending in response to the Great Recession. Eh... His focus is wrong. You're supposed to realize that increased Federal spending is a policy response to recession, an offsetting increase in spending intended to stimulate the economy. (Whether that policy actually works is a separate topic.)

There is a lot of related but irrelevant stuff in things people say. That's what the word focus means -- to prune away the irrelevant.

"Gross domestic product is used to measure a country's economic growth and standard of living. It measures neither," Mr. Arnott says flatly. "GDP measures spending..."

GDP measures "final" spending, not "spending". It excludes all of the preliminary spending that goes into a final product in order to avoid double-counting, because the preliminary spending is costs are already included in the price the consumer pays, the "final" price. Not a big deal. But if you're going to be critical, like Mr. Arnott and Mr. Milner, you may as well be accurate.

GDP counts "final" spending in order to measure the size of the economy. But the size of the economy can be measured as income instead of output: GDP is a measure of income. When the Federal government engages in deficit spending, its purpose is not to fake the size of the economy. Its purpose is to increase income.

You might think people would be happy about that.


Mr. Milner's article continues:

The problem, [Arnott] argues, is that the GDP figure fed to the public does not distinguish between consumption that is covered by current income and that which is financed by deficit spending. He likens it to a family with too many credit cards. The more credit they use, the higher the "family GDP" climbs. But that expansion is unsustainable. Once they are forced to slice up their cards, their GDP must plunge.

I want you to see two things in that paragraph. First, I want you to see that in Arnott and Milner's view, it's the part of GDP "which is financed by deficit spending" that is the "fake" part.

The second thing I want you to see -- perhaps a little more difficult to see -- is Arnott and Milner's assumption that the use of credit is a personal decision, and that the the excessive growth of debt in our time is the result of excessively bad personal decisions. Maybe that's a microfoundations-based concept, I don't know. I do know it's a crock.

The excessive growth of debt in our time -- since the end of World War Two, I mean -- is the result of flawed thinking, and of policies based on that thinking. We think printing money causes inflation and using credit doesn't. So we restrict the printing of money and encourage the use of credit. So debt increases. On top of that, we fail to encourage the repayment of debt. So of course our borrowing increases and of course our debt grows and of course it becomes a problem.

But when the costs of accumulated debt become a burden that hinders economic growth, we don't see the burden of debt. We only see that growth is slow. So we fix our policies, to make them do more to encourage the use of credit, because using credit is good for growth.

Well, yeah, using credit is good for growth. But it also adds to the accumulation of debt, and that's not good for growth.

I don't know if you can see all of that in the paragraph about the family with too many credit cards. But think about it, and keep an open mind.

Saturday, May 24, 2014

Related fragments


At the Library of Economics and Liberty, David Henderson writes:

Why do I make such a strong distinction between the 1960s and the 1970s? Because in the 1960s, the dominant view about economists in macro was Keynesianism, the dominant ideology was statism, and the leading economist was the late Paul Samuelson. By the late 1960s, that had started to shift and by the mid-1970s, the shift was well under way. By the late 1970s, the dominant macro view was either monetarism or rational expectations ... and the leading economist was Milton Friedman.


From Marcelle Chauvet and Zeynep Senyuz:

Before October 1979, the Federal Reserve (Fed) used to target bank reserves in the financial system. A measure of the tightness of monetary policy was the changes in the federal funds rate. In October 1979, the Federal Reserve Bank adopted new operating procedures shifting their emphasis from targeting the federal funds rate to the quantity of non-borrowed bank reserves in order to achieve the desired rates of growth in the monetary aggregates.


From Understanding Open Market Operations by M.A. Akhtar:

The formulation of monetary policy has undergone significant shifts over the years. In the early 1980s, for example, the Federal Reserve placed special emphasis on objectives for the monetary aggregates as policy guides for indicating the state of the economy and for stabilizing the price level. Since that time, however, ongoing and far-reaching changes in the financial system have reduced the usefulness of the monetary aggregates as policy guides.


From Macroeconomics by N. Gregory Mankiw:

In 1993, Fed Chairman Alan Greenspan announced that the Fed would pay less attention to short-run fluctuations in monetary aggregates.

Friday, May 23, 2014

At Asymptosis: (Modern) Monetarist Thoughts on Wealth and Spending


The full title of the post is (Modern) Monetarist Thoughts on Wealth and Spending: Volume or Velocity?

I started our writing a brief comment at Asymptosis in response to the post. But it stopped being brief. So my choice was to prune it and leave it there, or bring it here and let it grow. The latter.

Don't be surprised if my words here sound as though I'm talking specifically to Steve Roth.


From Roth's opening:

"... 'money' should be technically defined, as a term of art, as 'the exchange value embodied in financial assets.'"

We see things differently. To me, money is the medium of exchange, not the exchange value. It sounds like you're talking about erosion of the dollar's value. But I think you are talking about the liquidity of financial assets.

JW Mason might agree with you that this is what money is today. I don't disagree; it is what money has become. But I see this as the source of our economic troubles. Things that are not money have come to be widely used and accepted as money.


You make things too complicated:

dollar bills aren’t money. They’re embodiments of money

Jesus, Roth. The embodiment of money IS money.

Money and currency aren’t the same thing, and economists’ conceptual confution of “money” with “currency-like things” is central to the difficulties economics faces in understanding how economies work.

How economies work? But since the crisis, or before, economies DON'T work. Currency-like things are the things we spend... things that are current, things that flow. Take a dollar out of the flow and tuck it away as "assets", and it is no longer in the current: It no longer flows.

Graph #1:Household Financial Assets per dollar of Currency-Like Things

By the third paragraph, you're building a story on a definition that you hope is safe: "Add up the value of all financial assets, and that’s the money stock."

Nonsense.


In the paragraph just before your graph, you seem to confuse two definitions of the word "real". Here's the offending sentence:

We see this clearly when we look at recessions and the year-over-year change in real (inflation-adjusted) household assets — a measure of households’ total claims on real assets...

The one meaning of "real" is "inflation-adjusted" as you point out. The other meaning is not monetary. Real assets are things like the drill press you sometimes write about. Financial assets do not become in that sense "real" when you drain the inflation out of them.

I took a look at the total household assets from your first graph, in comparison to total household financial assets:

Graph #2: Total (blue) and Financial (red) Household Assets

Looks like financial assets are the larger part of the total. Real assets -- homes, factories, drill presses -- the smaller part.

Then too, there's some confusion just after your first graph. You write:

When people have less money, they spend less, and GDP declines, or grows more slowly. That is hardly a counterintuitive conclusion.

But before that, you said:

If they want to spend more, there will be more currency-like stuff around; the Fed will ensure it.

You say it's obvious -- hardly counterintuitive -- that when we have less money we spend less. But you also say that if we want to spend more, the money will grow to accommodate us. Your statements are contradictory.


Further, if all financial assets are money as you say, then to calculate the velocity of money one would divide GDP by total financial assets. Not by total assets as you show in your second graph. Not that I buy the premise.


At the end, you pull the inequality rabbit out of the hat. Some readers will like your post because you give them the ending they want. No matter it's non sequitur.

And your last words:

At the very least, the goal should be to reverse the rampant radical upward distribution of the last thirty years

Okay. So look at policy changes since the late 1970s, and reverse them. But don't blather me with nonsense and error.

Thursday, May 22, 2014

"Gillibrand is one of 29 co-sponsors of the measure that could save graduates thousands of dollars on their repayments."


From timesunion.com:

With student loan debt surging, U.S. Sen. Kirsten Gillibrand on Tuesday pushed for legislation that would allow graduates to refinance their loans at lower rates.

"People are spending all their money to pay back debt instead of investing in the economy," she told reporters during a conference call. "It's a huge drag on the economy."

In one example, refinancing could save "$70 to $100 a month". It's not nothing. But it only eases things. It doesn't turn the trend around. We need to accumulate less debt. You know what's gonna happen: You save $70 a month on student loans now, and you're feeling pretty good, and pretty soon you go out and put that new TV on the credit card...

Policy has to change. The Fed has to keep an eye on the ratio of private debt to circulating money; and Congress has to create policies that encourage repayment rather than accumulation of debt.

Once this is done, we can eliminate a lot of the policies established since the 1980s that were designed to moderate inflation by keeping wages down. And rising wages will mean we have money enough that it doesn't kill us to pay down our debt a little faster. Something we want to do, anyway.

Wednesday, May 21, 2014

When it's too late, it'll be too late


From MNI News
MONDAY, APRIL 14, 2014 - 14:48

US CBO Report Highlights Coming Surge in Debt Service Payments

By John Shaw

--Congressional Budget Office: Growing Debt, Rising Rates Will Ignite Interest Payments
--CBO: Annual Debt Service Costs To Approach $700 Billion By FY2021
--CBO: Debt Service Costs Will Exceed $5.8 Trillion Over FY2015-FY2024 Period

WASHINGTON (MNI) - While the Congressional Budget Office's most recent update of its economic and budget baseline does not offer any startling new insights into U.S. fiscal policy, it paints into even bolder relief one profound fact: the enormous impact that growing debt service costs will have on U.S. fiscal policy in the next decade - and beyond.

The article continues on, and, it turns out, it's all about the Federal debt. At least, I'm pretty sure. They talk about "our debt", but in the same paragraph they compare it to the defense budget and "other domestic agencies". And it's a CBO report. They've gotta be talking about the Federal debt.

But the private sector owes more debt than the Federal government, and pays higher interest rates. So if rising rates are a problem for the government, rising rates are a bigger problem for the private sector.


The article also says this:

The CBO says that as the economy strengthens interest rates will rise considerably.

Know what? That's a good reason to go with the Arthurian plan to accelerate the repayment of private sector debt: Keep interest rates low, and use tax incentives instead to nudge a little more money into debt repayment.

Policy has to change.

Tuesday, May 20, 2014

There's nothing wrong with the common trope


At the Slack Wire: The Nonexistent Rise in Household Consumption:

There's a common trope in left and heterodox circles that macroeconomic developments in recent decades have been shaped by "financialization." In particular, it's often argued that the development of new financial markets and instruments for consumer credit has allowed households to choose higher levels of consumption relative to income than they otherwise would. This is not true. Rising debt over the past 30 years is entirely a matter of disinflation and higher interest rates; there has been no long run increase in borrowing.

When Mason says "This is not true" he is referring to the belief that households chose "higher levels of consumption relative to income" for the past 30 years. He is NOT referring to the "common trope" that financialization increased. Obviously financialization increased.

UPDATE 4:25 AM...


Monday, May 19, 2014

The Repayment of Household Debt


When there is a dollar of debt for every dollar of income, paying down 10% of the debt takes 10% of the income.

When there is $10 of debt for every dollar of income, paying down 10% of the debt takes all of the income.


I've seen graphs of debt repayment as a percent of disposable income. Never saw anything on the amount of debt repaid as a percent of debt outstanding.

We can look at debt service to see how much debt we pay off each year, and then compare "debt paid off" to "debt outstanding" to see the relation between these two.

At FRED a search for debt service turned up lots of hits. One of the first was "household" debt service payments out of "disposable personal income". I know there are measures of household debt, so "household debt service payments" might make a good comparison. I looked a little more and found three measures of debt service as a percent of disposable personal income:

Graph #1: Three Measures of Debt Service out of Disposable Personal Income
At first glance the blue line looks a lot higher than the others. But the vertical axis doesn't go all the way down to zero, so the red and green are higher than they look. I wonder: if I add the red and green together, do they equal the blue?

Graph #2: "Consumer" + "Mortgage" Debt Service Payments as % of DPI (red, dashed)
overlaid on "Household" Debt Service Payments as a Percent of DPI (blue)
Looks like it from here. That could be useful information.

So anyway, I'll use the total, the "household" debt service number.

I should be able to get household debt service in dollars -- or, billions -- by undoing the "Percent of DPI" calculation.

If I was figuring debt service as a percent of disposable personal income, I'd divide debt service by disposable personal income (DPI) and multiply by 100. To undo the calculation and get the debt service number back, I'd divide by 100 and multiply by DPI. Now I know how to get "household debt service" from FRED's household debt service ratio -- divide by 100 and multiply by DPI.

Graph #3: Household Debt Service Payments, in Billions
For DPI I used FRED's DSPI
Crap. It only goes back to 1980. Oh, well.

Now we can look at household debt service payments, the number from Graph #3, as a percent of household debt:

Graph #4: Household Debt Service Payments as a Percent of Household Debt
For "Household Debt" I used FRED's CMDEBT

Wellsir, it seems we're paying down debt even slower now than before the crisis. That can't be good.

Notice the flat spot there, in the latter 1990s when the economy was doing good.

I wonder what this ratio looked like before 1980.

Sunday, May 18, 2014

Simple


Debt is a stock that accumulates, year upon year.

Income is a flow that starts again at zero, every year.

Therefore, unless we choose to prevent it, debt will grow till it dwarfs income.

Saturday, May 17, 2014

Nuanced Monetarism


In The General Theory, Maynard Keynes said

we can draw the line between "money" and "debts" at whatever point is most convenient for handling a particular problem.

In Capitalism and Freedom, Milton Friedman wanted

to carefully manage the quantity of money, but he didn't care what money was managed, what monetary aggregate. It didn't concern him at all.

According to Keynes, where you put the dividing line between money and debt depends on the problem you're trying to solve. According to Friedman, it doesn't matter where you put the dividing line.

Friday, May 16, 2014

Something must have caused it


Yesterday's post was too brief to be so thumbs-downish. I didn't feel good about that, and I want to take a longer look at Marcus Nunes's post today.

Marcus opens with an excerpt from Mian and Sufi that lays out their picture of "why the housing bubble tanked the economy and the tech bubble didn’t":

The sharp decline in home prices starting in 2007 concentrated losses on people with the least capacity to bear them, disproportionately affecting poor homeowners who then stopped spending. What about the tech crash? In 2001, stocks were held almost exclusively by the rich. The tech crash concentrated losses on the rich, but the rich had almost no debt and didn’t need to cut back their spending.

An interesting picture, from my perspective.

Marcus then quotes David Beckworth, who disputes Mian and Sufi's view. Beckworth admits "it is true there was far more U.S. household debt leading up to the Great Recession" than the 2001 recession. But he considers debt a symptom, not a cause. "In my view," Beckworth says,

the underlying cause was interest-rate targeting central banks running up against the ZLB... The failure by central banks to get around the ZLB caused most of the household deleveraging, not the other way around. Monetary policy, in other words, was too tight during the crisis.

Monetary policy was too tight, Beckworth says.

Relative to what?

I don't read much Beckworth so I don't know, but I imagine he'd say money was too tight relative to the needs of the economy.

To this straw Beckworth I must reply: That's not specific enough.

If money is tight, then obviously it is tight relative to the needs of the economy. But interest rates are at the zero bound. That's as loose as money can get. So the problem cannot be that interest rates are too high.

In the same David Beckworth post that Marcus Nunes quoted, Beckworth says

the real problem is the ZLB. Debt, itself, is not the problem. This is because for every debtor there is a creditor who could provide offsetting spending if the interest rates adjusted down to their natural rate level. This adjustment process is impeded when the natural interest rate is negative since nominal interest rates cannot go below zero percent.

Now, Steve Roth responds to the "for every debtor there is creditor" part of that. I think it's the best banks are not intermediaries argument I've ever seen. But I'm going to skip right over it, because I have a different concern.

Beckworth says debt only became a problem because "the natural interest rate is negative". Okay, but why is the natural rate of interest negative? Sunspots?

C'mon, David. Something must have caused it.

Interest rates are as low as they can go. We can't fix the problem by lowering rates more. So it's obvious to me that the problem is NOT that interest rates are too high. The problem is NOT that money is too tight. There must be some other problem, that is related to money and interest rates.

That problem is debt: excessive private sector debt.

Look: Lowering interest rates did fix the problem, before we got to the ZLB. It worked by making credit less expensive. Other people may offer complicated explanations, but if you lower interest rates you make credit less expensive.

But now we've reached the lower limit and credit is still too expensive. That's Beckworth's argument I think. So, suppose it's true. How can we make credit less expensive when interest rates are low as they can go?

Let me ask the question another way: How can we make total debt less expensive, without lowering interest rates? Only one way: Reduce the size of total debt.

The trouble is, we need some interesting new economic policy to make it happen. Because as things stand now, the only way available to us to reduce the size of total debt is to pay debt down. And paying debt down takes money out of circulation. And then you get the situation where interest rates are at the zero bound and money still seems too tight.

17 May 2014 EDIT: Changed "Other people may have complicated explanations" to "Other people may offer complicated explanations"

Thursday, May 15, 2014

Marcus comes up empty


Marcus Nunes:

The fact is that in after 2007 the poor man was doubly penalized. On the one hand his nominal income took a plunge and insult was added to injury when his job was taken away! The chart compares nominal income growth (NGDP) during the two cycles. Is it hard to see why consumer spending (and all the other components of GDP) and employment crashed?

The chart shows a big drop in Nominal GDP during the Great Recession.

Looking at that big drop, Marcus says it is easy to see "why consumer spending (and all the other components of GDP) ... crashed".

Marcus says, in other words, that the reason all the components of GDP crashed is that GDP crashed.

Sir, that explains nothing.

Wednesday, May 14, 2014

One interesting thought


Tuesday, May 13, 2014

Gavin Kennedy: A metaphor is a metaphor


GK at Adam Smith's Lost Legacy :

In treating a metaphor as a real entity which they believe actually operates in society you end up with fantasies. When these fantasies are believed by economists, including Nobel Prize Winners, you leave reality and belittle claims to economics being a science.

Monday, May 12, 2014

Fungal Inflation


Kinda makes you miss the good old days when we didn't need the fungus excuse to raise prices. Oh, sure, there were newsworthy shortages of toilet paper and sugar and Cabbage Patch dolls, back when. But at least we didn't have to worry about the Cabbage Patch fungus.

Sunday, May 11, 2014

Myth in 'The Myth of the Great Moderation'


From a five-minute video you can see at Lars P. Syll... naked capitalism... heteconomist... EconoMonitor...

Syll says "Just watch it", but I can't. I have to say something. When I see something wrong, I have to say something. Don't you?

Here's a snapshot from the video:


Third item on the lists says there was a change from "wage-led growth" to "debt-led growth". I have trouble with that. It suggests new borrowing grew significantly faster in the later period. But that's not correct.

Back in March, at New Left Project, Andrew Kliman evaluated Sam Gindin's take on the global economic crisis. Kliman wrote:

According to Gindin, workers’ incomes stagnated as their wages declined or grew slowly. This not only boosted profits but also contributed substantially to the growth of the financial sector as workers became 'dependent on credit' in order to keep their standard of living from falling. In particular, they 'came to depend heavily on their homes as collateral for borrowings.'

However, although Gindin cites a lot of data elsewhere in his article, almost no hard evidence accompanies this account of capitalism under 'neoliberalism,' and the hard evidence fails to support much of it. Since something like this account has become conventional wisdom among much of the Left, it is important to review the facts in detail.

According to Kliman, the "conventional wisdom" is not correct. He says

the share of personal consumption spending funded by consumer credit––i.e. all household borrowing except for home mortgages––did not rise over time. In other words, consumption did not increasingly come to depend on consumer credit.

Consumption did not increasingly come to depend on consumer credit.

That assertion of Kliman's stopped me cold the first time I read his article. It should make you stop, too. It should make you second guess yourself, as it did me.

Well, maybe you don't like second guessing yourself. But I'm pretty sure you do like this: the Fisher Dynamics of household debt. As Mark Thoma said,

this research knocks a hole in the story that it was lack of self control ... that caused the increase in household debt prior to the financial crisis

When Thoma says it wasn't a lack of self-control, he means it wasn't increased borrowing that caused debt to increase. At Thoma's link, JW Mason summarizes the research:

It’s a well-known fact that household debt has exploded in recent decades, rising from 50 percent of GDP in 1980 to over 100 percent on the eve of the Great Recession. It’s also well-known that household borrowing has increased sharply over this period. ... In fact, though,... while the first [of these] is certainly true, the second is not.

Mason says the same thing as Kliman: We think consumption increasingly came to depend on credit since 1980, but that's not correct.

Now you have to stop and think.

Now you have to take a step back from the conventional wisdom. Doesn't matter how cute that five-minute video was.

We have to get this right.

Debt grew faster after 1980 than before, not because of an increase in borrowing, but because of the disinflation.

Saturday, May 10, 2014

Squaring the circle


From The world economy may well be stuck in neutral for years:
It is now nearly seven years since the start of the financial crisis, yet despite growing evidence in America and Britain of a return to relative normality, something remains profoundly broken at the heart of the world economy. One manifestation of this – much discussed among the officials, finance ministers and central bankers gathered in Washington this week for the spring meeting of the International Monetary Fund – is the persistence of unnaturally low interest rates...

Very low interest rates are, in essence, the natural corollary of a stagnating economy.

Money has rarely been as abundant and cheap, but there is nowhere productive for it to go.

Unfortunately, no meaningful way of squaring the circle is offered.

"Money has rarely been as abundant and cheap, but there is nowhere productive for it to go."

That's not quite right. There is nowhere profitable for the money to go in the productive sector. That's what they mean, I think. But it's not what they said. And being unclear on that small point is the reason there seems no way to square the circle.

There's too much money in finance. Not enough money is spent out of finance. Basically, not enough money is pissed away. Money that you piss away is how other people make a profit. If you refuse to do anything with your money other than count it, nobody can profit at your expense.

If the people with all the money all hang on to it, nobody can make a profit. As long as nobody can make a profit, there is nowhere profitable for money to go. And when there's nowhere profitable for money to go, people say things like "there is nowhere productive for it to go."

Friday, May 9, 2014

Maybe the problem is excessive debt.


Syll quotes Roger Farmer:

The NK economist accepts Milton Friedman’s concept of the natural rate of unemployment which asserts that, in the long run, there is a unique equilibrium level of unemployment associated with stable inflationary expectations. If inflation appears, following a recession, a policy maker who accepts NK economics will infer that the economy is operating above potential. If unemployment is now 6%, rather than 3%, it must be that the natural rate of unemployment has increased.

Okay, but why has the natural rate of unemployment increased? Sunspots?

C'mon, Jack. Something must have caused it.

Thursday, May 8, 2014

Zero Hedge: Two Points


From Here's A Chart You Won't See On CNBC at Zero Hedge:
Today, we are happy that more are starting to notice this simple math problem. Here is Deutsche Bank's Torsten Slok who is the latest to be struck by this "revelation".

If you look at cash levels relative to debt levels you find that corporate cash holdings are at the lowest level in 15 years...

Good point. Cash -- or let's say money -- relative to debt, is an important measure. Hmmm... Where have I seen it before?

Today, I am happy that ZH is starting to notice.

//

Zero Hedge makes a good follow-up point:

Of course, as long as rates are low and keep declining, this record debt hoard is not a big issue.

Once rates start going up, however, nobody would possibly have been able to foresee the absolute massacre that will take place at corporations, levered with publicly tradable debt to never before seen levels.

You hear that all the time, about government debt. "If rates go up, there'll be a problem". But it is just as true outside of government as in, as ZH notes.

Wednesday, May 7, 2014

"Non-Financial Sector" = Productive Sector


From 3 April:

The point is not that there's just as much financial income as there is financial cost. The point is that there's no production, nor any consumption, associated with either financial income or financial cost.

Every dollar of credit that was used for production or for consumption could instead have been spent out of income. There need be no loss of production or of consumption by this different economics. There is only less need for finance.

It all comes down to management of money. Government has to make its money such that people want to use and accumulate it. But government must prevent people from accumulating so much of it that they undermine the government's management of its money.

You'll often see people say the government must prevent people from spending so much money that the result is inflation. My focus is not so much on the using as on the accumulating -- on the failure to use.

The balance between use and accumulation is key.

// Related post: Disastrous, cumulative and far-reaching repercussions of saving

Tuesday, May 6, 2014

"Five Short Blasts" Forum


Pete Murphy writes:

Real sciences are rooted in data, and real scientists go unafraid wherever the data takes them... Scientists examine all possibilities.

I like that: go unafraid wherever the data takes you.

That's it, yeah.

Monday, May 5, 2014

An Important Ratio


Nick Edmonds:

The quantity that is determined by bank lending is not money, but total bank debt. Money, our purchasing power, is just a subset of that and is not fixed by the amount of lending.

That's right. And the relation between the two quantities is an important one. The debt-to-money ratio increased from 1916 to 1970, except during the FDR years:

Graph #1: Total (Public and Private) Debt per Circulating Dollar
After FDR, our economy saw a golden age, followed by the end of those good times. But the debt-to-money ratio continued increasing until the crisis, except for a few years just before the good economy of the latter 1990s:

Graph #2: Total (TCMDO) Debt per Circulating Dollar
When the ratio is low and increasing, the economy is good. When the ratio is high and increasing, the economy struggles. When the ratio falls, whether by policy or crisis, it creates conditions for the return of the good economy.

Keep the ratio permanently low by creating policies that accelerate the repayment of debt, and we create the monetary conditions for a permanent quasi-boom.

Sunday, May 4, 2014

I said a little, and reduced it. Graeber said nothing, and expanded on it.


Here's what I wrote:
What is Debt?

Debt is a measure of credit that has been put to use, and a record of required repayment.

Debt is a cost.

Here are words that fill the box, repeated by the usually excellent Syll:
What is Debt?

What’s been happening since Nixon went off the gold standard in 1971 has just been another turn of the wheel – though of course it never happens the same way twice. However, in one sense, I think we’ve been going about things backwards. In the past, periods dominated by virtual credit money have also been periods where there have been social protections for debtors. Once you recognize that money is just a social construct, a credit, an IOU, then first of all what is to stop people from generating it endlessly?

Focus, now. The question was, "What is debt?"

Saturday, May 3, 2014

A way in to Minsky


At Debtwatch, a 16-minute talk by Steve Keen -- Oh! the accent reminds me of our computer guy at work.

Keen uses his Minsky software to model the economy under austerity and stimulus. It wasn't awesome, but I don't wish I could have my 16 minutes back.

Anyway, you can download both Minsky and the model from the link. Excellent, if you've been thinking about experimenting with Minsky.

19+ meg, as a zip file. Wow.

I'll let you know how it works out.

Paying down debt is the right way to fight inflation


Why is paying down debt the right way to fight inflation?

In our time? You're kidding, right? Look at the damn graph:

Graph #1: GDP (red) and Total Credit Market Debt (blue)

Friday, May 2, 2014

"The best guarantee of full employment and price stability" is... full employment and price stability


Comparing unemployment and inflation rates to Federal Reserve targets, Ed Dolan writes:

First, as market monetarists point out, the best guarantee of full employment and price stability over the long run is steady growth of nominal GDP in the range of 4 to 5 percent per year.

Comparing Irving Fisher's Debt-Deflation Theory of Great Depressions to Frank Herbert's Dune story, Geerussell writes:

Market monetarists would be the Guild Navigators, huffing spice and folding space to move from point A to point B avoiding everything in between.

That sums it up perfectly.

Thursday, May 1, 2014

... Author, Libertarian, and American Enterprise Institute Scholar.


Real Time
Bill Maher
Episode 315
25 April 2014

Bill Maher's guests included Charles Murray -- author, libertarian, and American Enterprise Institute scholar.

I transcribed some of the conversation from Episode 315, beginning at 42:50.

Charles Murray:

But if you're talking about taxes
here's the real problem.
If you want to jack up the rates on the really rich
the amounts of money that that'll bring in are trivial
compared to jacking up rates on the middle class.

The money, if you want to raise more money,
it's going to have to come from
tax rate increases on the middle class
and nobody's going to do that.

Maher: I agree.

Murray: Nobody's gonna do it.

Maher: Well, if they have to, they will.


I'm sure Murray's argument is *not* that rich people are poor. His argument must be that there just aren't enough rich people to make taxing them worthwhile.

Want to argue that point? Don't. You could rebut him with the story that the worlds richest 85 people have more money than the poorest three billion, whatever the numbers were, I don't remember. But don't get sucked in. You know their argument is bullshit, the "we have to balance the Federal budget" argument. Don't let them make an argument based on the need to balance the Federal budget. Don't let them choose the topic.

Murray presents a picture of our economy that is like a snapshot, a still life. It's a picture of a big hole in the ground -- the Federal debt -- and a big pile of dirt, which is the money that the rich people have, or the poor people or somebody. Murray wants us to buy this static image, discover that we're the ones with the big pile of dirt, and... and I don't know what. He wants us to decide NOT to want to fill the hole? That can't be right.

Maybe he wants us to throw our hands up in disgust, and give up our quest.


I want you to realize that the static image is the wrong image. The economy isn't static. The economy is dynamic. The economy is motion. The economy is activity. The economy is transaction. Income. Flow.

You don't fill the hole by shoveling this pile of dirt into that hole. You fill the hole gradually, a little at a time in a full length motion picture, by tweaking things every now and then when a pile seems to be getting too big or a hole too deep.

If you're talking about taxes
you're talking about tweaking things.

I don't want to jack up the rates on the really rich. I think we should have a standard deduction well above poverty level, and a flat tax on income over that, a flat percentage that would work out to be progressive because of the large standard deduction. And then we should have an upper limit to what a person can earn in a year -- a lower limit on the value of the dollar is what that is, and wealthy people should like that idea -- and on income above that upper limit the tax rate is 100%. Not 70% or 90% or any kind of equivocation like that. A one hundred percent tax on income above whatever, ten million dollars a year, maybe. Ten million is too high, from my perspective, but the dollar's not worth much any more.

Tweak it: set a limit.

You don't raise taxes "to raise more money". You tweak taxes to get money flowing in the directions you want. And then when people learn how to take advantage of the tax code -- that's the "Lucas critique" I think -- you change the tax code again.

Did you notice? I'm not talking about how high or low taxes should be. I'm talking about what kind of taxes we should have.