From a comment here.
The economy moves in a way that tends to correct imbalances. Our task is to understand what the economy sees as an imbalance, and to make policy cooperate with the economy and satisfy its needs, so that it behaves in a way that satisfies us.
Wednesday, April 30, 2014
 Just like that
Federal Reserve holdings of U.S. Treasury securities:
 |
| Graph #1: U.S. Treasury Securities held by the Federal Reserve via Random Eyes |
And a little later they tried to stablilze it again, at twice the level. But pretty soon they had second thoughts again.
Now they're way up there at 2.4 million million, three times where they were before the crisis.
Now people worry about inflation, when all that money starts feeding loan demand. Everyone who thinks it might be a problem wants to solve the problem by having the Fed get that number back down where it was before the crisis.
That's the wrong approach. Doing it that way, you put the economy right back where it was before the crisis: primed and ready to have a crisis.
We don't want to do that.
The problem, the inflation, arises when those extra funds start feeding loan demand. No problem yet, because loan demand has been sluggish, right? Okay. So that's a clue.
If we have three or four times the money we had before, that's good. The problem is half solved. All we have to do is make sure that loan demand is held down to a third or a quarter of what it was before. Then everything balances out.
You want to say I'm crazy. I want to say you're confusing new loan demand with total loan demand. New loan demand is new uses of credit. Total loan demand is existing, outstanding debt plus new uses of credit.
It's the new uses of credit that help the economy grow. It's the existing, outstanding debt that makes financial cost excessive. It's the existing, outstanding debt that undermines demand. It's the existing, outstanding debt that we don't need. It's the existing, outstanding debt that we should start paying off, as a way to fight inflation.
Just like that.
Tuesday, April 29, 2014
Some imbalances are corrected by the fall of civilization
I don't often read Greg Mankiw. But his First Thoughts on Piketty snagged me. In that post Mankiw asks:
What does r>g tell you in a standard overlapping generations model?
He gives this answer:
That the economy is dynamically efficient (that is, it has not over-accumulated capital).
I think this is what he means: If the economy had over-accumulated capital, then r would fall, becoming less than g.
Sort of like, if they print too many dollars, the value of the dollar falls.
Mankiw's answer is a little too brief and dismissive for me. For one thing, r might fall due to over-accumulation of capital without becoming less than g.
But here's what really bothers me:
Mankiw's answer assumes that the relation between r and g is the natural result of economic forces. Yet I know for a fact that economic policy encourages the growth of r. It encourages the growth of r as a way to encourage the growth of g.
Man interferes with nature. Policy distorts the "natural" economy. It's supposed to do that, yes. But you can't then turn around and argue, as Mankiw argues, that things that happen because of policy are natural results. That argument is used all the time, and it is wrong, all the time.
Because policy interferes, r>g tells us nothing about the over-accumulation of capital. Mankiw's assertion is baseless.
One more thing... Mankiw's answer appears to depend on what Anatole Kaletsky calls "an inbuilt assumption that the economy is self-stabilizing." Mankiw thinks everything comes naturally to balance in the economy, like water seeking its own level. If there is an over-accumulation of capital, he thinks, the economy will naturally change so that the over-accumulation dissipates and balance is restored.
Maybe... but on what terms, and at what scale? The business cycle is part of that natural process. So is the Kondratieff wave. And so is the Cycle of Civilization.
Monday, April 28, 2014
Velocity and the Great Moderation
 |
| Graph #1: Percent Change from Previous Quarter, M1 Velocity |
And just for the hell of it:
 |
| Graph #2 |
Sunday, April 27, 2014
Kaletsky: Replacing "defunct" with nothing
Revised 4:24 AM -- shortened.
Reuters: Opinion: Kaletsky: Time to stop following defunct economic policies
Anatole Kaletsky asks, "Can economists contribute anything useful to our understanding of politics, business and finance in the real world?"
Why does not Stiglitz offering an alternative? Or if he does, why is not Kaletsky quoting the alternative, instead of the overly-dramatic question?
Well... Stiglitz's answer there, it says the models are no good. (One hears that often, lately. It's not economics; it's a meem.) Yeah, he's probably right about that, Stiglitz, but so what? He does not answer his own question:
Why are they still using that absurd model?
It's Stiglitz's question, not mine. But he didn't answer it. He complained that the model is no good, which is like, his answer is a tautology, a restatement of the question as opposed to an actual answer.
Based on Stiglitz's complaint -- that the models "ignore the existence of banks" as Kaletsky put it -- the productive answer would be to present a model that doesn't ignore the existence of banks. Or to correctly describe the economy, and leave the modeling to others. But Stiglitz's answer was empty.
Kaletsky apparently liked Stiglitz's answer:
See? Kaletsky's going for the bizarre -- the overly dramatic, I said -- rather than the relevant. And he's going for the zinger. Kaletsky finishes his thought with a zinger:
Zingers are fun. But they don't solve problems.
So, so far, no: economists don't "contribute anything useful to our understanding of politics, business and finance in the real world".
Reuters: Opinion: Kaletsky: Time to stop following defunct economic policies
Anatole Kaletsky asks, "Can economists contribute anything useful to our understanding of politics, business and finance in the real world?"
Joseph E. Stiglitz, the Nobel laureate, asked rhetorically in Toronto: “Why are central banks and governments still trying to predict the effects of their policies with an economic model that is manifestly absurd?”
Why does not Stiglitz offering an alternative? Or if he does, why is not Kaletsky quoting the alternative, instead of the overly-dramatic question?
[Stiglitz's] answer was that the economic models studied in universities and published in leading academic journals are still largely based on a simplifying concept, known as the Representative Agent, which effectively assumes that “everyone in the economy is the same.” So these models have nothing to say about lending or borrowing, ignore the existence of banks and treat bankruptcies as unimportant because “when the borrower does not repay, he only defaults on himself.”
Well... Stiglitz's answer there, it says the models are no good. (One hears that often, lately. It's not economics; it's a meem.) Yeah, he's probably right about that, Stiglitz, but so what? He does not answer his own question:
It's Stiglitz's question, not mine. But he didn't answer it. He complained that the model is no good, which is like, his answer is a tautology, a restatement of the question as opposed to an actual answer.
Based on Stiglitz's complaint -- that the models "ignore the existence of banks" as Kaletsky put it -- the productive answer would be to present a model that doesn't ignore the existence of banks. Or to correctly describe the economy, and leave the modeling to others. But Stiglitz's answer was empty.
Kaletsky apparently liked Stiglitz's answer:
Amazingly, these economic models with no banks are still the main analytical tool used by most central banks. Peeling away further layers of the theoretical onion reveals something even more bizarre: an inbuilt assumption that the economy is self-stabilizing.
See? Kaletsky's going for the bizarre -- the overly dramatic, I said -- rather than the relevant. And he's going for the zinger. Kaletsky finishes his thought with a zinger:
This means that virtually any policies the central bank may choose to follow will lead automatically to full employment — in the forecasts, if not in the real world.
Zingers are fun. But they don't solve problems.
So, so far, no: economists don't "contribute anything useful to our understanding of politics, business and finance in the real world".
Saturday, April 26, 2014
Change in Total Debt relative to GDP relative to Total Debt
 |
| Click the Graph to Visit the FRED Source Page |
Why?
Because the change in total debt is a boost to GDP, and total debt is a drag on GDP.
The graph looks at both "change in total debt" and "total debt" relative to GDP. The general trend of the line should look like GDP except as it is influenced by "change in total debt" pushing it up, and by "total debt" pushing it down.
You can see by the trend that total debt is the dominant factor.
Friday, April 25, 2014
"When the lawgiver has once fixed the law of inheritance, he can rest"
From Democracy in America, Tocqueville:
When the lawgiver has once fixed the law of inheritance, he can rest for centuries; once the impulse has been given to his handiwork, he can take his hand away; the mechanism works by its own power and apparently spontaneously aims at the goal indicated beforehand. If it has been drafted in a certain way, it assembles, concentrates, and piles up property, and soon power too, in the hands of one man; in a sense it makes an aristocracy leap forth from the ground. Guided by other principles and directed toward other goals, its effect is even quicker; it divides, shares, and spreads property and power...
I spent two hours looking through the book for that quote. Finally gave up and googled it. Many, many thanks to Numerian from The Economic Populist in 2010, and also at Daily Kos in 2005. At the older link, Numerian sources the quote:
It is found in Volume 1, Chapter 3, ""Social State of the Anglo-Americans," within the first section of this chapter. DeTocqueville's work is quite lengthy and you may have one of the many abridged versions. It's well worth reading the whole thing - the extraordinary insights into America follow one after the other.
Also, the thing is translated (from French). So if you have a different translation, your text won't exactly match Numerian's quote. Below is a version from page 66 of Democracy in America (PDF) translated by Henry Reeve:
When the legislator has regulated the law of inheritance, he may rest from his labor. The machine once put in motion will go on for ages, and advance, as if self-guided, towards a given point. When framed in a particular manner, this law unites, draws together, and vests property and power in a few hands: its tendency is clearly aristocratic. On opposite principles its action is still more rapid; it divides, distributes, and disperses both property and power.
It occurs to me that there are few references to this statement on the Internet.
We should fix that.
Thursday, April 24, 2014
Notion of Rights Dissemination of Wealth
From Democracy in America, Tocqueville:
The government of the democracy brings the notion of political rights to the level of the humblest citizens, just as the dissemination of wealth brings the notion of property within the reach of all men; to my mind, this is one of its greatest advantages.
Wednesday, April 23, 2014
Advantages of Democracy in the United States
From Democracy in America, Tocqueville:
Democratic laws generally tend to promote the welfare of the greatest possible number; for they emanate from the majority of the citizens, who are subject to error, but who cannot have an interest opposed to their own advantage. The laws of an aristocracy tend, on the contrary, to concentrate wealth and power in the hands of the minority; because an aristocracy, by its very nature, constitutes a minority...
Aristocracies are infinitely more expert in the science of legislation than democracies can ever be. They are possessed of a self-control which protects them from the errors of temporary excitement; and they form far-reaching designs, which they know how to mature till a favorable opportunity arrives. Aristocratic government proceeds with the dexterity of art; it understands how to make the collective force of all its laws converge at the same time to a given point. Such is not the case with democracies, whose laws are almost always ineffective or inopportune.
Tuesday, April 22, 2014
Take a walk on the wild side
Following up on Gene's link...
From: Interpreting Deviations from Okun’s Law by Mary C. Daly, John Fernald, Òscar Jordà, and Fernanda Nechio at the Federal Reserve Bank of San Francisco:
The article explains those loops in a way that makes good sense to me. (I didn't quote that part. You should read it.) The bit I quoted is just detail information about the loops. But I want to stop and smell the detail:
These loops reveal an underlying characteristic of the U.S. business cycle. Changes in employment—and likewise unemployment—lag behind changes in GDP.
Got it? The loops tell us something about the business cycle. What they tell us is that changes in the supply side lag behind changes in the demand side.
The supply side follows the demand side. That's what those loops tell us.
Supply follows demand.
From: Interpreting Deviations from Okun’s Law by Mary C. Daly, John Fernald, Òscar Jordà, and Fernanda Nechio at the Federal Reserve Bank of San Francisco:
Whether we analyze Okun’s law with real-time or revised data, countercyclical loops tracing the relationship over time are a common feature. These loops reveal an underlying characteristic of the U.S. business cycle. Changes in employment—and likewise unemployment—lag behind changes in GDP. For example, faced with a shortage of demand, it takes time for firms to adjust staffing levels.
The article explains those loops in a way that makes good sense to me. (I didn't quote that part. You should read it.) The bit I quoted is just detail information about the loops. But I want to stop and smell the detail:
Got it? The loops tell us something about the business cycle. What they tell us is that changes in the supply side lag behind changes in the demand side.
The supply side follows the demand side. That's what those loops tell us.
Supply follows demand.
Monday, April 21, 2014
Trends and tendencies
I typed employment in the FRED search box, went down the list that came up, and picked three different measures:
 |
| Graph #1: Three Measures of Employment |
They all have humps in the same places. They all have dips in the same places. They accelerate and decelerate and respond to crisis in unison. So does it really matter which one you use to evaluate our economic past?
It might, if you are looking at some particular detail. It might. But if you're doing macro, it might not matter very much. And if you're just sticking a toe in the water, it would make very little difference.
You probably would want to check all of those lines, eventually, to see if your observations and conclusions apply in all cases. Of course. I'm not saying it is okay to be closed-minded about such things. But if you want to choose a data-set by throwing darts, I don't see anything wrong with that.
I usually pick the one that shows the most years.

When I change the graph to show not "Thousands of Persons" but instead "Percent Change from Year Ago", the three lines still move as one:
 |
| Graph #2: Growth Rates of the Three Measures of Employment |
That pattern reminds me of something: inflation-adjusted GDP. Here in black:
 |
| Graph #3: Growth Rates of the Three Measures of Employment and Real GDP |
Shouldn't be surprising, really, the similarity between employment and output. It's Okun's law.
Sunday, April 20, 2014
XP
Had a little trouble with my computer at work the other day.
I don't know what the problem was. I mean, I didn't go in and reverse-engineer the code and figure it all out. But I do know what was different.
The only thing that was different is that XP is no longer "supported".
What happened is, I left my computer on when I left work on Tuesday, so that the "Microsoft Security Essentials" could do its weekly virus scan Tuesday night. That wasn't different -- I do it every week. But when I got to work on Wednesday morning and turned on the screens, there was an error message:
MsMpEng.Exe -- Application Error
The instruction at "0x5a4d684d" referenced memory at "0x00000000". The memory could not be "read".
Click on OK to Terminate the program.
Click on CANCEL to debug the program.
The instruction at "0x5a4d684d" referenced memory at "0x00000000". The memory could not be "read".
Click on OK to Terminate the program.
Click on CANCEL to debug the program.
And there was another message hiding under that one, that I found when I clicked OK to the first message:
AntiMalware Service Executable has encountered a problem and needs to close.
That all doesn't mean a whole lot to me. But the part that said it tried to "reference memory at 0x00000000" -- that means something. The ox (the first two characters of the number, zero and the X) means it is a hexadecimal number (base 16) but the big piece of info in that number is that everything after the ox is zeros. The instruction at some memory location tried to reference the memory location zero. I've seen that error before. Something wasn't properly initialized. That's why the value is zero.
And the thing was slow as hell. Took 8 or 10 minutes for Windows XP to boot up, and as long again for AutoCAD to load up and open a small drawing. I dicked around with it till my supervisor came in. Do anything without being authorized first, and you're liable to be accused of causing the problem you're trying to fix.
When my supervisor came in I laid out the problem for him. He said: try the System Restore -- a good idea; I had not thought of that -- and then uninstall the Microsoft Security Essentials. I liked that plan, and (to make a long story short) it worked. And I'm more convinced than ever that the problem was created by XP support shutting down. They left a dangling end there, and when I tried to use the scan, the problem showed up.
But that's what I think. My supervisor thought it was probably the hard drive going bad. He's told me lots of stories over the years, where a failing hard drive was always the problem. But he didn't read the error messages I got.
What I'm thinking is that, when you have a complex system like a computer, it is sometimes difficult to pin down the cause of a problem. And if you are quick to turn to the internet for an answer, you may find the most popular answer rather than the most accurate one.
What I'm thinking is, when you have a complex system like the economy, it is sometimes difficult to pin down the cause of a problem. And if you are quick to turn to an authority for an answer, you may find the most popular answer rather than the most accurate one.
Saturday, April 19, 2014
Do imports account for the decline of US production?
One of the components of GDP is "net exports". As you know, net exports went seriously negative since about 1980:
 |
| Graph #1: Balance on Current Account See also this comparison at FRED |
But how big is that trade imbalance, anyway? What if we could zero it out? What would GDP look like if we don't reduce it for net exports? I mean, we can add the value of those imports to GDP, as if we produced the stuff here. It will bring the GDP number up -- but how much? What would Real GDP growth look like, then? Would it still be trending down? In other words, do imports really account for the decline of US production?
Here's how the Balance on Current Account looks in comparison to GDP:
 |
| Graph #2:Balance on Current Account (blue) and GDP (red) |
If we subtract our growing trade deficit from GDP we get a number that's larger than GDP by the amount of the trade deficit. Graph #3:
 |
| Graph #3: GDP (red) and GDP with the Trade Deficit Subtracted (blue) |
It's higher, yes, but not a lot higher.
These things always surprise me.
So now, if we look at the growth rates of those two lines...
 |
| Graph #4:Growth Rate Comparison |
And if I show Graph #3 after taking the natural log of the values, the two lines follow a similar path. Both show a slowdown in the early 1980s:
 |
| Graph #5:Log Scale Comparison |
Two more graphs to look at, and we're done. I want to strip out the inflation, and compare the two versions of "real" GDP:
 |
| Graph #6: "Real" Values, Log Scale Comparison |
 |
| Graph #7: "Real" Values, Growth Rate Comparison |
Friday, April 18, 2014
A Desperate Expedient
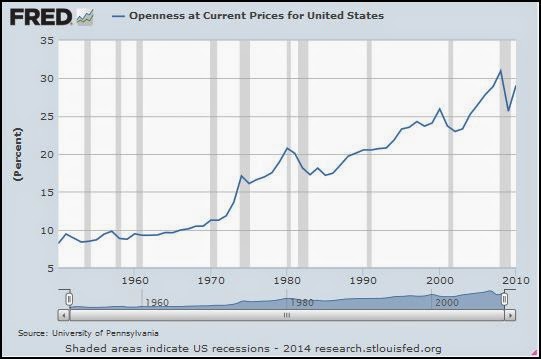
I never saw this one before. Openness:
 |
| Graph #1 |
At FRED the notes on it say:
Exports plus Imports divided by GDP is the total trade as a percentage of GDP. More information is available at http://pwt.econ.upenn.edu/Documentation/append61.pdf
Exports plus imports. Openness. Here's the same data on a log scale:
 |
| Graph #2 |
'If nations can learn to provide themselves with full employment by their domestic policy....there would be no longer a pressing motive why one country need force its wares on another or repulse the offering of its neighbour...so as to develop a balance of trade in its own favour. International trade would cease to be what it is, namely a desperate expedient to maintain employment at home by forcing sales on foreign markets and restricting purchases which, if successful, will merely shift the problem of unemployment to the neighbour which is worsted in the struggle'.
Thursday, April 17, 2014
One of my favorite lines from Keynes:
It is astonishing what foolish things one can temporarily believe if one thinks too long alone...
What Maynard is telling us here is that if you want to understand the economy, you are going to have to do a lot of independent thinking.
He is telling us what he did.
Wednesday, April 16, 2014
"laying the groundwork for the first rate hike"
Tim Duy:
Overall, the Fed appears committed to a long period of low interest rates and I continue to think this should be the baseline view. But actually policy seems to remain hawkish relative to the Fed's rhetoric. By its own admission, the Fed is missing badly on both its mandates. Why then the push to reduce accommodation by ending asset purchases and laying the groundwork for the first rate hike?
Here's the argument Tim Duy is taking a turn at: It's time to start fighting inflation. No, it's not. Yes, it is. No it's not.
Here's the policy version of that argument: It's time to start raising interest rates. No it's not. Yes, it is. No, it's not.
Here's the problem: We need to stop using interest rates to fight inflation.
Does what I'm saying seem irrelevant? Actually, my argument is the relevant one. It's using interest rate hikes to fight inflation that's irrelevant -- and plain wrong -- because we use credit for growth. The policies contradict. Our policy of raising interest rates contradicts our policy of getting good growth. We have to fight inflation a different way.
We should fight inflation by paying down private debt faster. It's time to create policies that encourage and reward the accelerated repayment of debt.
Tuesday, April 15, 2014
Siding with Sumner
Scott Sumner:
Before we consider whether we are likely to repeat the mistakes of the 1960s era Fed, let’s review precisely what those mistakes actually were. Here’s the data as of November 1966:
Unemployment rate = 3.6%, and falling.
Inflation = 3.6% over previous 12 months. That’s a big increase from the 1.7% of the 12 months before that, and the 1.3% inflation rate two years previous. The “Great Inflation” began here.
...
Keep this data in mind when some fool tells you that the Great Inflation was caused by oil shocks or the Vietnam War or budget deficits or unions, or some other nonsense.
So let me add a little something to that. Sumner says it's not the Vietnam war that caused the inflation, and not Federal deficits. (He also says it's not the oil shocks of the 1970s that got inflation going in the 1960s. That can stand on its own, I think.) Here's a picture of the Federal deficits from 1950 to 1970. Bigger is higher on the graph:
.jpg) |
| Graph #1 |
Now you can certainly say that the 1968 deficit was a big one, for the 20-year period we're looking at here. And you might say the 1967 deficit was a big one. But the deficits were small in 1965 and 1966; you can see that for yourself. Yet as Sumner points out, the rate of inflation was already climbing vigorously by 1966.
The Federal deficits did not cause the Great Inflation.
You know what I think: The rising cost of finance was the cost that started driving prices up, by the mid-1960s.
Monday, April 14, 2014

Sunday, April 13, 2014
Inflation and Economic Growth
From the PDF by Robert Pollin and Andong Zhu:
This paper presents new non-linear regression estimates of the relationship between inflation and economic growth for 80 countries over the period 1961 – 2000. We perform tests using the full sample of countries as well as sub-samples consisting of OECD countries, middle-income countries, and low-income countries. We also consider the full sample of countries within the four separate decades between 1961 – 2000. Considering our full data set we consistently find that higher inflation is associated with moderate gains in GDP growth up to a roughly 15 – 18 percent inflation threshold...
Hyperinflations aside, the relationship between inflation and growth has been at the very center of macroeconomic theory debates since the monetarist counterrevolution against Keynesianism beginning in the 1960s. The main progeny of that counterrevolution—the “natural rate of unemployment,” the vertical Phillips Curve, and New Classical Economics more generally—have been focused largely around demonstrating that there can be no positive benefits for economic growth or employment of operating an economy at anything above a minimal inflation rate in the range of 2 – 3 percent...
This position contrasts sharply with the Keynesian perspective and the early Phillips Curve models, which held that inflation and economic growth can be positively associated when inflationary pressures emerge as a byproduct of rising aggregate demand. In this Keynesian framework, it is not the case that inflation is itself a positive engine of growth, certainly not a primary growth-inducing force. The point is rather that, if rising aggregate demand is leading to increased growth, then some inflationary pressures are likely to emerge in this scenario as a relatively benign byproduct...
Considering first our full data set of 80 countries between 1961 - 2000, we have consistently found that higher inflation is associated with moderate gains in GDP growth up to a roughly 15 – 18 percent inflation threshold.
via Reddit.
Saturday, April 12, 2014
"Wreckage"
From The History of the Phillips Curve: Consensus and Bifurcation by Robert J. Gordon (PDF, 41 pages, 2008):
Introduction
The history of the Phillips curve (PC) has evolved in two phases, before and after 1975, with a widespread consensus about the pre-1975 evolution, which is well understood...
The pre-1975 history is straightforward and is covered in Section I. The initial discovery of the negative inflation–unemployment relation by Phillips, popularized by Samuelson and Solow, was followed by a brief period in which policy-makers assumed that they could exploit the trade-off to reduce unemployment at a small cost of additional inflation. Then the natural rate revolution of Friedman, Phelps and Lucas overturned the policy-exploitable trade-off in favour of long-run monetary neutrality. Those who had implemented the econometric version of the trade-off PC in the 1960s reeled in disbelief when Sargent demonstrated the logical failure of their test of neutrality, and finally were condemned to the ‘wreckage’ of Keynesian economics by Lucas and Sargent following the twist of the inflation–unemployment correlation from negative in the 1960s to positive in the 1970s.
From After Keynesian Macroeconomics by Robert E. Lucas and Thomas J. Sargent (PDF, 34 pages, 1978):
1. Introduction
We dwell on these halcyon days of Keynesian economics because, without conscious effort, they are difficult to recall today...
That these predictions were wildly incorrect, and that the doctrine on which they were based is fundamentally flawed, are now simple matters of fact, involving no novelties in economic theory. The task which faces contemporary students of the business cycle is that of sorting through the wreckage, determining which features of that remarkable intellectual event called the Keynesian Revolution can be salvaged and put to good use, and which others must be discarded.
For the record...
The "negative" correlation of the Phillips Curve is the tradeoff: a little more inflation and a little less unemployment, or the reverse. The "positive" correlation is when both inflation and unemployment increase, or both decrease.
The negative correlation displays the tradeoff for given economic conditions. The positive correlation shows what happens when economic conditions improve or get worse. When people deny the existence of the tradeoff, it is because they are considering the long term, during which the condition of the economy varies. Even so, the tradeoff still applies to the short term.
But the proper fix for our economy is not to fiddle with the short-term tradeoff. The proper fix is to figure out how to improve conditions over the long term.
Friday, April 11, 2014
Profit versus Interest
Buried deep within JW Mason's The Puzzle of Profits lies a simple insight:
One other thing to clear up first: profit versus interest. Both refer to money tomorrow you receive by virtue of possessing money today. The difference is that in the case of profit, you must purchase and sell commodities in between.
It's an important difference. In the case of profit, you have to come out of the world of finance and deal in the world of real products. Things get done. Things get built. Things get made. GDP expands. Income grows. Wealth increases. All of that.
I take from Milton Friedman the idea that "money" should grow in proportion to "output", and not faster. When things get done and built and made, output expands. And when output expands, it's okay if the quantity of money grows, too. Not a hard and fast rule, but a good conceptual one.
So, when profit is being made, output is increasing and money, one hopes, along with it.
But when interest is being earned, nobody said anything about output.
//
I'm leaving out important things here. I'm leaving out that Friedman didn't clearly define "money". I'm leaving out that money shouldn't grow slower than output, either. And I'm leaving out the one that's so hard for the "money is debt" people to understand -- that when the money grows, the portion of it that costs interest should not grow faster than the portion that doesn't cost interest.
Yeah, I left out those things. But I only left them out of the post. Others leave them out of their explanations of the world.
I left them out because I want you to distinguish between interest and profit.
Thursday, April 10, 2014
That's what I was trying to show!
I showed you this graph back in November, and even dwelt on it some.
 |
| Graph #1 |
 |
| Graph #2 |
 |
| Graph #3 |
Well done, gentlemen.
Wednesday, April 9, 2014
Check out Luke's graph!
First graph from Luke's Is US Consumer Spending About to Take-Off:
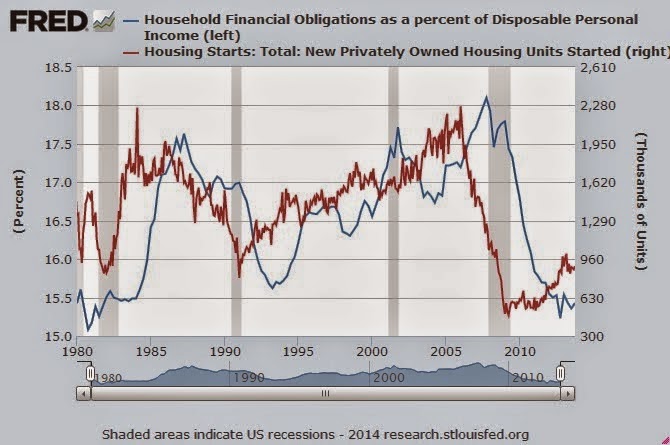 |
| Luke: "a kind of out-of-phase correlation between household financial obligations and housing starts" |
Tuesday, April 8, 2014
Zoho: Inflating Debt Away
At Historinhas, Marcus gives us The new “one size fits all”: 4%. The post is a look back at calls for a higher rate of inflation than the 2% the Fed promises to deliver.
Several quotes in the post agree with the one that says the reason to push inflation higher is "to leave more room for nominal rate cutting during bad times." That just seems an odd reason, to me.
I want to look at the effect of a higher inflation rate on debt and prices.
Enter values in the yellow cells following the examples given. The graph shows the ratio of debt to nominal GDP for two different rates of inflation. Above the graph, in Column F, the spreadsheet displays the increase of prices after 25 years at the two inflation rates you entered.
This all assumes that your income inflates at the going rate, and your share of income doesn't lose ground.
Monday, April 7, 2014
I Call Bullshit
Reddit is a gold mine, I swear. I found Greg Ransom's Stephen Williamson’s “New Monetarism” = F. A. Hayek’s Monetary Economics in a New Bottle with a New Label at Reddit with a link to Taking Hayek Seriously -- where you find a photo of Hayek laughing his ass off!
Here's part of a Hayek excerpt from Ransom's post:
It is necessary to take account of certain forms of credit not connected with banks which help, as is commonly said, to economise money, or to do the work for which, if they did not exist, money in the narrower sense would be required. The criterion by which we may distinguish these circulating credits from other forms which do not act as substitutes for money is that they give to somebody the means of purchasing goods [or securities] without at the same time diminishing the money spending power of somebody else.
I want to focus on a particular phrase at the end of that quote: "without at the same time diminishing the money spending power of somebody else."
If I go to the bank and borrow a dollar, a new dollar is created, one that didn't exist before. So my having that dollar does not at all diminish the money spending power of somebody else, Hayek says.
On the other hand, if I borrow a dollar from you to get a candy bar from the vending machine at work, you can't spend that dollar until I pay you back. So your spending power IS diminished, in this case.
This is the difference Hayek refers to, with that particular phrase.
I followed Ransom's link to the Stephen Williamson: New Monetarist Economics blog, to see this quote at the source:
A New Monetarist thinks that, under current circumstances (a large stock of excess reserves, and the interest rate on reserves - IROR - determining short nominal rates) the inflation rate is determined by the demand for and supply of the whole gamut of intermediated liquid assets - including Treasury debt of all maturities and asset-backed securities. We can't even measure everything we want to in that respect...
So Williamson, the host of the New Monetarist blog, tells us what a New Monetarist thinks, which is that "We can't even measure everything we want to" when it comes to intermediated liquid assets.
But as Williamson says elsewhere, "one person's liability is another person's asset." So if we can't measure the assets, then we can't measure the liabilities. In other words, we can't measure private debt.
It is while expressing concern about inflation that Williamson says we can't measure debt, in his 16 March 2012 post titled Inflation. Even though we can't measure the debt, he is concerned about the inflationary effects of debt.
Now I have to bring you back to Williamson's of 12 July 2012, where in a comment JSR said "leverage was much smaller in 1980" and Williamson shot him down with this one-liner:
"Depends how you measure private debt, I think."
Williamson makes this point while dismissing the claim that the ratio of private debt to GDP was higher in 2007 than in 1980 and while defending his argument that "debt overhang" since 2008 is responsible for neither high unemployment nor slow growth.
In mid-March of 2012, Williamson complained that we can't measure debt, yet he was concerned that there was so much debt it would cause inflation. Four months later, in mid-July, he denied that there was more private debt in 2012 than there was in 1980, and denied that debt was sufficient to create problems.
Bullshit, Williamson. You can't have it both ways.
Your argument is that there's more than enough debt -- or "assets" -- to cause inflation, but not enough to cause unemployment and slow growth. Come to think of it, you are describing the way things were in the 1970s. But debt only grew since then, bud.
Sunday, April 6, 2014
Galbraith via Syll
Galbraith sees nothing to prevent a reduction in the reliance on credit:
There is no reason to think that financial capitalization bears any close relationship to economic development. Most of the Asian countries, including Korea, Japan, and China, did very well for decades without financialization; so did continental Europe in the postwar years, and for that matter so did the United States before 1970.
By James K. Galbraith at Dissent, quoted by Lars P. Syll.
From part 2 of Galbraith's piece, something people often forget -- that conditions result from policy:
The massive equalization in the United States between 1941 and 1945 was due to mobilization conducted under strict price controls alongside confiscatory top tax rates. The purpose was to double output without creating wartime millionaires. Conversely, the purpose of supply-side economics after 1980 was (mainly) to enrich the rich. In both cases, policy largely achieved the effect intended.
Saturday, April 5, 2014
Selgin did good.
George Selgin:
I don't consider myself an Austrian economist for the same reason that I don't consider myself a Chicago economist, or a Keynesian economist, or a New Classical economist, or a--well, you get the point. I don't want to belong to any economic school of thought, or to "do" any sort of economics. I just want to "do" my own sort of economics.
Nice. Maybe I should call my blog I just want to do my own sort of economics.
Oh! Come to think of it, I did.
The economy changes, you know? How can you adopt the ideas of some defunct economist and pretend to explain the world by those ideas? I call myself a student of the economy. I'd much rather understand the economy, than economics.
// Related posts:
Self-Slotting Economists
Savings That Once Went
Friday, April 4, 2014
Zoho: Real GDP Comparator
The graph below compares two 20-year periods of quarterly Real GDP data. Enter a four-digit year value (a number between 1947 and 1993) in each of the two yellow cells. Note that the last data is for 2013, and 20 years before 2013 is 1993. So if you enter a start-date after 1993, the graph runs out of data and the line crashes down to zero.
The two series are indexed, each to its own start-date value. The two lines both start at the value 100. So you can see how the two 20-year periods compare by seeing which line is higher, which is lower, and how the movements differ.
Have fun!
Thursday, April 3, 2014
Two searches
One search, at Williamson's site:

The other, at mine:

Google found 322 hits for "debt" on Williamson's site, 2600 on mine.
Williamson again???
The other day I quoted JSR...
As far as debt goes, leverage was much smaller in 1980
... and Williamson's curt reply...
Depends how you measure private debt, I think.
...which I dismissed with a laugh:
So, like, if we don't count the debt we won't find an overhang, dude!
But it didn't sit right. Maybe Stephen Williamson knows something I don't. So I went back and did a search of his blog for "debt".
Google returned 316 results. Too much. Next I tried "private debt".
36 results. But a lot of them feel like responses to Williamson's posts. I'm looking for Williamson here. So then I tried "measuring private debt".
In quotes? zero results. No quotes? 2 point 9 million results -- and that's just at http://newmonetarism.blogspot.com/. Maybe that was a glitch. But the first of those results, number one on page one, was the same "HP Filters and Potential Output" post we've been looking at recently.
I tried "measure private debt" (in quotes). Google returned exactly one result, the same post we've been looking at. Then I trued measure "private debt". 24 results this time. Things like
The nominal interest rate is essentially a measure of...
You measure talent by the end result.
...the inflation rate is increasing in terms of core measures...
...typical measures of anticipated inflation...
and like that. You can have it. But I did come across this one:
Is the problem too much private debt?
Turns out, that one's from a Williamson comment on his Evans Speaks. Here's what I found:
Is the problem too much private debt? If so, one person's liability is another person's asset. Do we have a suboptimal distribution of wealth, and is the way to correct it then through an unanticipated inflation that redistributes wealth in just the right way? Couldn't we do a better job of redistribution with fiscal policy? Is the problem to do with costly defaults? Again, couldn't we correct the problem with fiscal policy? What about moral hazard? Don't we have to worry about that?
SWilliamson is throwing up a wall, a barrage of questions that he has no intention of evaluating, himself.
And yes, there it is, plain as day, for all to see:
"...one person's liability is another person's asset."
For all to see. Swilliamson, you miss the point. The point is not that there's just as much financial income as there is financial cost. The point is that there's no production -- and no consumption, either -- associated with either financial income or financial cost.
Wednesday, April 2, 2014
Tweakin'
Random Eyes turned up this graph:
 |
| Graph #1: Employee Compensation, Personal Income, and GDP All so Close Together it's Hard to Find Three Lines on the Graph |
And then I looked at the left border. It says (Index). That explains it. That's why the lines are so close together. That, and the pattern they share.
Anyway, I tweaked the graph to show the actual numbers -- billions of dollars, rather than some index.
 |
| Graph #2: The same three data series, in Billions of Dollars. The similarity of pattern persists. |
I thought it was interesting that the one graph shows the three series running close together, and the other shows them spreading apart. And I got wondering whether employee compensation is always about half of GDP. That first graph suggests an extraordinary similarity among all three series. I wanted to see whether that similarity says employee compensation and personal income are consistent, invariant portions of GDP.
 |
| Graph #3: Employee Compensation (blue) gradually falls as a Percent of GDP Personal Income (red) gradually rises as a Percent of GDP |
 |
| Graph #4: Employee Compensation falls as a Percent of GDP |
It looks like a substantial decline to me. So now I have to wonder why all the lines looked so close together in the first graph. They were indexed, which means the three lines were pinned together at one point.
That one point, in the first graph, was 2007. So the lines were pinned together toward the end, toward the right, when (as Graph #3 shows) this is where the biggest differences occur. So I'm thinking, if I pin the lines together earlier, say at the start of the 1970 recession, we will see them spread apart in the later years.
 |
| Graph #5: Same as Graph #1, but with the lines pinned together in at the 1970 recession |
 |
| Graph #6: Same as Graph #5, but showing only up to 1980 |
Tuesday, April 1, 2014
Williamson: "If you weren't seeing the debt overhang effect in the 1981-82 recession, why are you seeing it now?"
From that Williamson post I've been looking at...
Here is a set of explanations that I have heard for the recent behavior of economic time series:
Wow. I think he means the recent behavior of the economy. Anyway...
Here is a set of explanations that I have heard for the recent behavior of economic time series:
(i) Wages and prices are sticky.
(ii) There is a debt overhang. Consumers accumulated a lot of debt post-2000, the recession has compromised their ability to service that debt, and they have reduced consumption expenditures substantially.
(iii) Consumers and firms are anticipating higher taxes in the future.
(iv) Sectoral reallocation has caused mismatch in the labor market.
(v) Capacity has been reduced by a loss of wealth, or perhaps more specifically, collateralizable wealth.
It's obviously number two there that gets my focus: There is a debt overhang. That's where I'm going. I just have to work up to it.
On the first item, sticky prices, Williamson says
The 1981-82 recession occurred in the midst of a rapid disinflation, from close to 15% (CPI inflation) in early 1980 to 2.5%, post-recession. If there was a time when wage and price stickiness would matter, that would be it.
Stickiness didn't matter then, Williamson says, so it can't make much difference now. Then he moves on to his second point:
Debt Overhang: Again, think about the 1981-82 recession. The unanticipated disinflation would have made a lot of debts much higher in real terms than anticipated. If you weren't seeing the debt overhang effect in the 1981-82 recession, why are you seeing it now?
See, this time it's a question. Williamson leaves a door open. I'm going in.
If you weren't seeing the debt overhang effect in the 1981-82 recession, why are you seeing it now?
Maybe because, in 1981-82, the significant increase of debt had not even begun:
 |
| Graph #1: Total Credit Market Debt relative to GDP |
Maybe because, in 1981-82, people were fed up, but not yet desperate:
 |
| Williamson's 8th: Employment Picked Up in the 1980s, but not This Time. |
Maybe because, in 1981-82, President Reagan was putting a whole new economics in place. People were optimistic.
 |
| Graph #3: "Consumer Sentiment" After falling from its 1965 peak, in 1983 confidence skyrocketed. Confidence remained high until the 1991 recession, then fell. After the '91 recession, confidence grew only slowly and did not reach a high level until economic performance itself was good. "Expectations" worked in 1983, but have not worked since. Fool me once, shame on you. Fool me twice, shame on me. |
Why were people optimistic? Well obviously if the old economics was wrong, Reaganomics had to be right. Didn't turn out that way, no. But that's what people thought. Some still do, blaming the old economics for the new problems.
In comments on Williamson's post, JSR said
As far as debt goes, leverage was much smaller in 1980 -- the ratio of private debt / GDP was nowhere near the levels just before 2008, so there wasn't a significant debt overhang problem.Graph #1, above, confirms this. Williamson, however, sees it differently:
Depends how you measure private debt, I think.
So, like, if we don't count the debt we won't find an overhang, dude!
Williamson also says "The 1981-82 disinflation is huge." I agree. I wish Williamson said more about that. For example, if inflation had continued at high levels, it would have pushed GDP and new borrowing up. But it would not have increased existing debt. And since existing debt is a good big chunk of total (existing+new) debt, continued high inflation would have prevented the dramatic increase that occurred in the 1980s.
 |
| Graph #4: Total Credit Market Debt relative to GDP (blue) and the Rate of Inflation |
To be sure, the growth of debt itself also contributed to that climb. Graph #5 shows the growth rate of total credit market debt, independent of GDP. In the early 1980s debt (blue) grew rapidly while the rate of inflation fell. Certainly this contributed to the upsurge of the blue line shown on Graph #4, above.
 |
| Graph #5: Total Debt Growth and the Rate of Inflation |
 |
| The 1980s Upsurge |
The sharp upturn on Graph #4 occurred only in the 1980s, and not in the 1970s, not because debt growth was slight in the 1970s, but because the rate of inflation fell in the 1980s.
The disinflation is huge, Williamson says. He is right about that. It was the disinflation, and the low inflation since, that allowed leverage to increase. It was disinflation, and low inflation since, that allowed the "debt overhang problem" to develop. But it is foolish to focus on the disinflation and not the growth of debt. For if debt growth had been contained, the disinflation could not have had such a huge effect on debt.
There was a question about debt overhang.
Williamson asks why we're seeing the debt overhang effect now, but not in the 1981-82 recession. His question is not quite right. We're seeing the effect now, certainly; but the Great Recession ended four or five years ago. We're seeing the effect now -- since the 2009 recession, not just in it. So the proper question to ask is this:
If you weren't seeing the debt overhang effect since the 1981-82 recession, why are you seeing it now?
And now the question is an easy one to answer. We were seeing the debt overhang effect since the 1981-82 recession. Economic growth slowed significantly at that time. And since the 1981-82 recession, the economy continued to underperform. It was only the massive and sudden, much worse underperformance since the time of the Great Recession that made the previous underperformance look good.
 |
| Graph #6: Stages of the slowdown in real growth |
Subscribe to:
Posts (Atom)
