Subtract consumer debt from GDP:
 |
| Graph #1: GDP less Consumer Debt |
Same graph, but log of values:
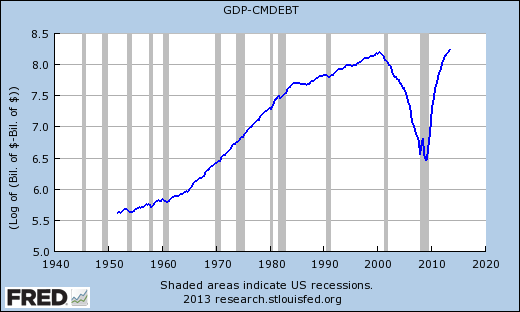.png) |
| Graph #2: Natural Log of (GDP less Consumer Debt) |
Challenging the Premisses
| Start with the debt problem, three views of it,
and the most important thing. Here's a longer look at the debt problem.
Here's a short one on economic policy, some surprising trends, and a few unusual policy recommendations. How'd we get into this mess? Read Policy Venn and Policies of the Venn Overlap. Still with me? Read A Matter of Life and Death. And for an overview, download my 12-page PDF |
|
| Graph #1: GDP less Consumer Debt |
|
| Graph #2: Natural Log of (GDP less Consumer Debt) |

No comments:
Post a Comment