Thursday, October 31, 2013

Josh Lehner: Economists' Halloween


At oregoneconomicanalysis.com Josh Lehner writes:

We hosted a Halloween party the other day here for all the babies in the local moms group and went all out with yard decorations. This is what happens, however, when you let an economist make the tombstones. They’re all famous, dead economists...

Components and Context


Yesterday's graph: components of debt, as a percent of total debt:

Graph #1: Components of Debt, relative to Total Debt
Nonfinancial other than Federal (blue) ... Federal Debt (green)
Financial Debt (red) ... Foreign Borrowings (orange)
Click the Graph for the FRED Source Page
Today, the same components of debt, as a percent of GDP:

Graph #2: Components of Debt, relative to GDP
Nonfinancial other than Federal (blue) ... Federal Debt (green)
Financial Debt (red) ... Foreign Borrowings (orange)
Click the Graph for the FRED Source Page
The only difference between the two graphs is the denominator. For Graph #1 the denominator is TCMDO debt. For Graph #2, the denominator is GDP. GDP grew more slowly than debt, so the lines go up more on the second graph.

The difference between the two graphs is substantial.


In a recent post, as an afterthought, I wrote: why they always show debt relative to GDP is beyond me.

Geerussell picked up on that, and responded:

I assume it's because looking at anything relative to GDP is convenient shorthand to get a sense of scale...

Jazzbumpa picked up on it, too, noting:

geerussell is right. It provides context. National [or any other kind of] debt right now is some big scary number, while the same debt in, say, 1921, would look like an insignificant number - without context.

Agreed. Agreed. But look at the two graphs above. Each graph has a "context". Each has a denominator to provide context. The denominators are different, that's all.

For comparing the components of debt, total debt is the better context.


// Related post: Federal Debt Held By Federal Reserve Banks

Wednesday, October 30, 2013

Let them eat pie


On Monday I took a lot of debt all lumped together, divided it by some measure of income, and looked at it in terms of good and bad. (Debt going up was bad.) Long story short, we didn't find anything but bad debt.

Today I want to break up the lump and look at some of the major pieces.

I took the two major parts of total credit market debt -- financial and nonfinancial -- and put them on a graph. Then, because everybody gets so worked up about the Federal debt, I took that out of the nonfinancial debt and gave it its own line on the graph. (Note that this is the "debt held by the public" part of the Federal debt, not the "gross" Federal debt. The gross debt includes the borrowing of Social Security funds -- which are not "credit market" funds, evidently.)

Finally, for ha-ha's I added a line to show what used to be called the "Foreign Sectors - Rest of the World" debt. Now it's called "Rest of the World; Credit Market Instruments; Liability, Level". Here's the graph showing all four pieces:

Graph #1: Major Shares of US Credit Market Debt
Nonfinancial other than Federal (blue) ... Federal Debt (green)
Financial Debt (red) ... Foreign Borrowings (orange)
Click the Graph for the FRED Source Page
The Federal debt (green) starts out about half of all credit market debt, falls with alacrity to about 20%, then essentially hangs there.

The rest of non-financial debt (blue) starts out about half of all credit market debt, rises with alacrity to about 70%, then gradually falls to 50%.

Financial debt (red) starts out at about 2% of all credit market debt, and rises for half a century.

Foreign debt (orange) dribbles along just above zero.

This graph shows portions of debt relative to total debt. It doesn't show debt relative to a measure of income. So we can't use it to talk about "good" and "bad" debt -- not if we want to stick to the definitions from Monday's post. Think of this as deep background.

Hey, here's a different look at the data presented in the graph above. Three snapshots 25 years apart. Again, blue is nonfederal nonfinancial debt; green is Federal debt held by the public; red is financial debt; and orange is foreign borrowing:

Green = Federal Debt ... Blue = Other Nonfinancial Debt ... Red = Financial Debt
1955

Green = Federal Debt ... Blue = Other Nonfinancial Debt ... Red = Financial Debt
1980

Green = Federal Debt ... Blue = Other Nonfinancial Debt ... Red = Financial Debt
2005

Tuesday, October 29, 2013

Set it aside


We protested what the government was doing, in my day too. You heard of the Viet Nam war, right? Still, we loved this country and only wanted to make things better. When the people protesting the anti-war protest said "Love it or leave it," I stayed.

We didn't do things to hurt the country. Edward Snowden did things to hurt the country. Every time his name comes up again in the news, it is because of some new thing that is hurting the country.

You find yourself sympathetic to Edward Snowden. Because of what the government is doing. Well I don't like it either, what the government is doing. But if Snowden wanted to expose some bad thing, he could have exposed that thing without exposing the whole soft underbelly and weakening the nation.

You find yourself sympathetic to Edward Snowden in ways I am not, why? Because you have been exposed to two generations of economic decline. You have been listening for 30 years to a growing chorus that sings of the evils of our government. And you take the economic decline as proof of it.

Challenge and response, Toynbee said. The challenge is our economic decline. Our response determines our destiny.

Civilizations die by suicide, Toynbee said. Set aside everything you've been told for the past 30 years, I say. Set it aside.

Monday, October 28, 2013

The good, the bad, and Type 3 ugly


Tripped over an old post and found something I've been meaning to write about: good and bad debt. Here's Arno Mong of Gang8:

Credit (and interest) is toxic only when it is spent unwisely, resulting in BAD (unpayable) debt. Debt is neutral both ethically and economically and not bad per se.

Debt is neutral, Arno says, and not bad per se. But what happens if debt grows twice as fast as everything else? Is it still harmless, twice as big? Wait a bit then, and debt is four times times bigger than everything else. Wait a bit, and debt is eight times bigger. Wait a bit, and debt is 16 times bigger. Is it still harmless?

32 times bigger...

64 times bigger...

128 times bigger...

256 times bigger than everything else. Is it still harmless? I can keep this up longer than debt can continue not being a problem, I guarantee it.

It is not the fact that there is such a thing as debt that is the problem. It's silly to say this could be a problem, though this is the problem Arno Mong evaluates when he says debt is not bad per se. The problem with debt is cost. The cost of debt is the problem.

Mention the cost of debt, and everybody thinks of interest rates. Hardly anyone thinks of how much debt there is. Yet if interest rates fall by half and the accumulation of debt doubles in size, the cost of debt is not likely to fall significantly.

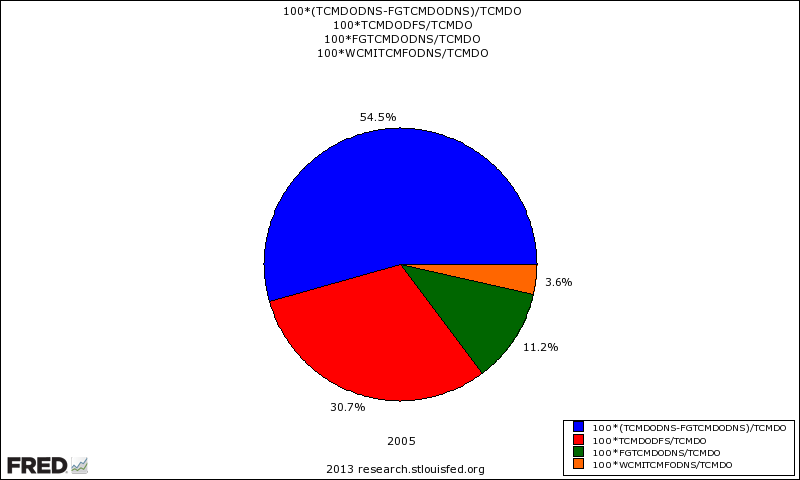
Graph #1 - Point of Interest: Monetary Interest Paid (red) is similar to
the Rate of Interest Multiplied by the Size of Total Debt (blue).
It is not obvious here that Interest Rates have been Falling since 1981
Again: It is the cost of debt that creates problems. Arno overlooks the fact.

As a philosophical concept, debt may be neutral both ethically and economically. But as a cost factor, debt is a problem that grows as it grows in size. Now, what else did Arno say?

"Credit (and interest) is toxic only when it is spent unwisely, resulting in BAD (unpayable) debt."

Arno defines "bad" debt as "unpayable" debt. That strikes me as true, but based on a strictly limited meaning of the phrase "bad debt". It is not useful for evaluating the ideas I want to evaluate.

What is "bad" debt? It seems there are some people who identify debt as "bad" if it is government debt, and "good" if it isn't. That approach barely skims the surface. But maybe my method doesn't go much deeper: I just lump all the debt together and figure it's bad if there's too much of it.

Many people are not satisfied with such simple definitions. Steve Keen, for example, says it is speculative debt that is bad. For Keen, speculative debt is unproductive. Keen sees no problem with accumulating debt as long as that debt is for productive use, and not for speculation.

Moritz Schularick, on the other hand, thinks if you get a mortgage to buy a new house, that's okay, but if the house you're buying is a few years old, it's a problem.

If you're buying the house to live in, and there's not a trace of speculation in your soul?

No matter: If it's not a brand-new house, Schularick says, you're part of the problem. Because the new house is new production, and the older house is not.

Then there's Michael Leddy of Orange Crate Art (not an economics site) who differs with both Keen and Schularick:

It is sad to say, but I’ll say it: Borrowing $64,000 to finance graduate work in the humanities is folly. Borrowing any amount of money to finance graduate work in the humanities is folly.

And in follow-up remarks:

People do borrow in sensible ways all the time (I think of the mortgage that went with our house), but for grad school in the humanities: not a good idea.

Mr. Leddy generally avoids economics on his blog. Even so, he has views on credit. In this case it appears he disagrees with Schularick on mortgages: Leddy does not say that "good" mortgage debt applies only to brand-new homes.

Finally, in comments on my Cost Hinders Growth, Jazzbumpa (of Retirement Blues and Angry Bear) and an anonymous commenter ("Nonny") develop the analysis I want.

Nonny says that if the ratio of debt-to-GDP is stable, then

income (i.e. GDP) is being generated at a rate such that leverage remains unchanged. More ideally, leverage would decline. This pretty much defines the debate about productive vs unproductive debt.

By that measure, then, an increase in debt is "productive" if it leads to a proportional or greater increase in GDP.

Jazzbumpa points to the debt of the financial sector (as opposed to that of the productive sector) and says, "There is your unproductive debt."

Nonny wholeheartedly agrees, but suggests that

only that by looking more closely at nonfinancial debt accumulation , you can determine those periods when such debt was more or less productively used - by the "real" economy.

So, peel off the unproductive financial debt, and look for productive and unproductive in the non-financial debt. Makes sense.

Responding to my tentative effort to clarify the difference between "productive" and "unproductive" debt -- "good" and "bad" debt, presumably -- in follow-up comments Jazzbumpa says:

Debt to use in real investment is productive. Financial debt does not qualify.

Nonny takes it a step further,

to suggest that the most productive debt is for investments that can generate the income stream to pay off the debt. Debt used for consumption will raise GDP, and even create jobs if enough people are using debt to consume, but no income stream is generated for the debtors, so eventually they hit the wall. Still, even consumption debt generates GDP, so it's better than debt used for speculative finance, like Jazz says, which just redistributes GDP.

This is great. Now we have:

1. debt that increases GDP and pays for itself;
2. debt that increases GDP but does not pay for itself; and
3. debt that neither increases GDP nor pays for itself.

Now one can see depth in the difference between good debt and bad debt. I suppose we could add Arno Mong's "unpayable" debt as number 4 on that list. It works for me.


Suppose we apply this hierarchy of good and bad debt to the US economy, and take the measure of bad debt.

One way to look at it is Arno's way: unpayable debts.

That's the IRS way, too. I Googled IRS bad debt data and found IRS Topic 453:

If someone owes you money that you cannot collect, you may have a bad debt...
A business deducts its bad debts from gross income when figuring its taxable income.

The search also turned up a Chapter 10 from the IRS, regarding business bad debts:

Business bad debts are mainly the result of credit sales to customers. Goods that have been sold, but not yet paid for, and services that have been performed, but not yet paid for, are recorded in your books as either accounts receivable or notes receivable. After a reasonable period of time, if you have tried to collect the amount due, but are unable to do so, the uncollectible part becomes a business bad debt.

The same search turned up this FRED graph of "bad debt expense":

Graph #2: Bad Debt Reported on Corporate Income Tax Forms (I think)
It's the first time I've looked at this graph, and I'm not comfortable with the long title FRED gives it. But it seems to make sense that this measure of bad debt from the IRS considers the bad debt reported on corporate tax forms. (As always, if you think I'm misinterpreting the graph, speak up.)

Okay, everything goes up. But how does "bad debt expense" compare to GDP?

Graph #3: Bad Debt Expense as a Percent of GDP
(The start- and end-dates on this graph differ from Graph #2 above.) Like Graph #2, Graph #3 shows a definite up-trend.

I need one more look at the "bad debt" corporate tax deduction -- this time relative to corporate profits:

Graph #4: Bad Debt Expense as a Percent of Corporate Profits
Graph #4 shows the same slow start as Graph #3. But this one is mostly below 10% before 1980, and mostly above 10% after 1980. And it shows a great immoderation in bad debt expense during the so-called Great Moderation.

These few FRED graphs show a definite long-term uptrend in bad debt expense. I don't suppose that surprises anyone, but I did have to see it for myself.

Bad debt expense. On our list of good and bad debt, it's Number Four: unpayables. The other three types of debt on our list all relate debt to GDP:

Type 1: down-trending debt, where GDP increases more quickly than debt;
Type 2: flat-trending debt, where GDP and debt increase at the same rate;
Type 3: up-trending debt, where GDP increases more slowly than debt.

For a first look at the debt-to-GDP ratio we can turn to the grandfather of debt productivity, Grandfather Hodges. Under the heading AMERICA'S DIMINISHED DEBT PRODUCTIVITY Hodges writes:

If America was more efficient in real productive employment of new debt, then less debt would be needed for each dollar of national income. But - - the reverse is true.

Less debt for each dollar of national income would mean the ratio was down-trending. But the reverse is true: The ratio is up-trending. We're a Type 3 debtor nation. Our GDP (like our National Income) increases more slowly than our debt. Our debt increases faster than our income.

Grandfather Hodges says "We are less productive regarding debt than ever before." Hodges is saying that our debt -- our total debt, not just the government's part -- is Type 3, up-trending debt. Our debt increases faster than GDP, now more than ever.

We are less productive regarding debt than ever before. Yup, that's what happens when you have up-trending, Type 3 debt.

Grandfather Hodges writes:
Each dollar of economic growth requires more debt per dollar than before - now over twice as much...

The left chart restates the above.

It shows that in 1957 there was $1.86 of outstanding debt for each dollar of national income.

But, today's economy needs $4.91 in outstanding debt for each dollar of national income.

That's 164% more outstanding debt load per dollar of national income.

That extra $3.05 of debt produced zero national income.

Hodges adds

if we look just at the period 2000 to 2010 total debt increased $30 trillion, while National Income increased but $4 trillion (GDP $4.6 trillion). In that period it took $7.50 in new debt to produce one extra $1 of added national income.

In a perfect world, less debt would be needed for each dollar of national income. But as Grandfather Hodges says, in our world the reverse is true. More debt is needed for each dollar of national income. And this has been true since 1957, as Hodges shows. As his graph shows.

Well now wait a minute. That graph just goes up and up and up. There is what, one tiny little spot just before 1967 on the graph, where the line goes down for about 1/8 of an inch. That's the down-trend. That's the "good" debt -- that's *all* the good debt since 1957, by our definitions above. We got 1/8 of an inch of Type 1 debt, and that's it.

And then from 1967 to 1970 maybe, the graph is flat. Well, not really flat; looks like it goes up by one pixel. But call it flat. So the flat-trend, that's Type 2 debt, where GDP and debt increase at the same rate. This is the debt that doesn't pay for itself, but at least it helps GDP go up.

All told, then, Grandfather Hodges' graph shows five or six years when we had Type 1 or Type 2 debt. Five or six years out of the whole 1957-2010 period when we did not have "bad" debt, based on our definitions above.

This is problematic.

Our Types-of-Debt list is reasonable, right? How about Grandfather's graph; is it wrong? No, it's not wrong:

Graph #6: TCMDO Debt relative to GDP (blue) and National Income (red)
The list we came up with, the four different types of debt, that list is very comforting, you know? It helps us understand the world. Or it seems to. But Grandfather Hodges' graph turns everything up-side down. The debt-to-GDP ratio only goes up.

If the Grandfather Hodges graph is right, and if our list of the types of debt is right, then our debt, public and private, has almost always been a problem. It has almost always been unproductive, Type 3 debt.

That doesn't really seem right, does it. And it's me saying it, the guy who always looks to debt first when there's a problem.

I know most people would rather be out of debt than in debt, but also, we all have our reasons for getting into debt. Is debt always unproductive? I think most people would say no. I think that's a good answer.

The graph is not wrong; debt goes up.

Out list of debt types is not wrong.

But we cannot interpret what the graph shows according to the list of types. How can this be?

I don't know. But here's what I think:

It's comforting to have a list like that, and it does make good sense. (I had a great time writing this post, working through Jazz and Nonny's comments, and coming up with that list of types of debt. I really did.) But it doesn't fit the data. It doesn't make sense when you look at the graph.

I know the graph is right.

I have to demote the list to a supporting role. A secondary role.

I'm left looking at a debt that is always growing faster than income, and I know it's a problem. I know not all that debt is unproductive; I know it in my heart. And I can't use the list to interpret that debt. So I have to demote the list to a tertiary role.

Ultimately, I'm left looking at all that debt, and I know it's a problem. So I say, just lump all the debt together, and figure it's bad when there's too much of it.

Sunday, October 27, 2013

At least he highlights the right part


In a recent post Nick Rowe quotes from the latest Bank of Canada report:
"Although the Bank considers the risks around its projected inflation path to be balanced, the fact that inflation has been persistently below target means that downside risks to inflation assume increasing importance. However, the Bank must also take into consideration the risk of exacerbating already-elevated household imbalances." (my bold)

(His bold.) Nick goes on to explain the bolded part:

Translation: "We would maybe like to cut interest rates to prevent inflation staying below target, but we are scared of doing this because it might cause some people to borrow too much..."

When the Bank of Canada refers to "already-elevated household imbalances" it means people have already borrowed too much and lowering interest rates more (according to Nick's translation) might cause people to borrow even more.

What problem does the Bank of Canada identify? Already-elevated household debt.

What problem does Nick Rowe overlook? Already-elevated household debt.

Nick's recommendation? "The best cure for 'easy money' is easier monetary policy". But Nick is not dealing with the problem. The problem is already-elevated household debt. Nick doesn't dispute it. He just argues around it, saying the Bank should lower interest rates and make money easier.

See how he takes the Bank's "elevated household imbalances" and reduces it to a problem of "some people"? If it was only "some" people who had borrowed too much, there wouldn't be a macroeconomic problem. Take out the word "some" and put in the word "most". While we're at it, take out "it might cause" some people to borrow too much, and use something less iffy: It has caused most people to borrow too much.

But it's probably not low interest rates that caused it. If Canada is anything like the US, it's all the encouragements to borrow built into the tax code and other policies. Things that don't even originate with the central bank.

Nick thinks he can solve this problem by making easy money even easier.

Saturday, October 26, 2013

Rewards for Good Behavior


Suppose you have a dog that doesn't listen. What can you do?

Give him treats. Reward the dog for good behavior.

But do you want to reward the dog when he doesn't do what you want?

He chewed the newspaper? Good boy, here's a treat.

He peed on the rug? Good boy, here's a treat.

That's NGDP Targeting: Rewarding the dog, no matter what it does.


To be honest, I don't know if I like that analogy. Oh, I think it's funny. I just don't know if it's relevant. To be sure, the economy is a dog that doesn't listen. And throwing money at it is like giving the dog treats. The imagery is good.

But I don't know that the economy responds the same way a dog responds. I don't know that. I sort of doubt it, actually.

Friday, October 25, 2013

The integrity thing, again


The Wikipedia article 1973–75 recession for some reason shows this graph:


The sawtooth blue line shows "percent change from preceding period" for RGDP; the flat red line is "average GPD growth 1947-2009". Average RGDP growth, I assume.

The red line is up a little over 3 percent. Just a snit over 3.3% by my calculation, based on quarterly data at annual rates.

But you know, they didn't know about that during the 1973-75 recession. They didn't know about the 1947-2009 trend. They only knew what had already happened. They didn't know what was to come.

What they might have known was that average RGDP growth for 1947-1973 was almost 4.1% annual. What they could not have known was that average RGDP growth for 1975-2009 was less than 2.9% annual.

Does it matter? Yes: The difference is more than one percent of GDP, every year. One percent of a trillion dollars is $10 billion. That's $10 billion for every trillion dollars of real GDP, every year, compounded.

If we grew at that 3.3% number since 1947 instead of 4.1%, by 1973 we'd have had an RGDP of only $4586 billion instead of the $5456 billion we actually got.

If we grew at the 3.3% number instead of 2.9% since 1975, by 2009 we'd have had an RGDP of $16,696 billion instead of the paltry $14,540 billion we actually got.

If we grew at the 4.1% number since 1975, as we did before 1973, by 2009 we'd have had an RGDP of $21,361 billion instead of $14,540 billion.

21 instead of 14. That's 50% more.

Why would anyone want to bury these figures in a long-term average? Are we trying to hide the fact that economic performance was far, far better in the years before the 1973-75 recession than in the years since?


// for documentation, the spreadsheet is available.

Thursday, October 24, 2013

The Integrity Gap


Graph #1:RGDP (blue), the 1947-1979 Trend (red) and the 1947-2012 Trend (black)

Wednesday, October 23, 2013

Real GDP and the Exponential Trend


Sometimes there are two lines on a graph that will fool you. They're not as close as they look. Numbers are much bigger these days than they once were, and as the numbers get bigger, on a graph the old numbers get squeezed down toward zero. The spaces between get squeezed down, too, so the lines look close together.

I'm thinking about Real GDP and the exponential trend.


Trend Determination


Table #1
I grabbed annual RGDP data from FRED the other day and started out looking at recessions and compound annual growth rates. Ended up looking at exponential trends. Wanted to look at the overall trend. And wanted to split the data into two parts, early and late, and compare the two trends.

Somewhat arbitrarily, perhaps, I settled on 1979 as the end point for the "early years" trend.

I made up a graph of RGDP values for the 1947-1979 period. Added an exponential trend line, displayed the trend formula, and formatted the formula with a larger font and increased decimal accuracy so I could get the numbers right.

Oddly, in order to get useful values in the Trend Line Formula, I had to remove the date labels from the graph. That left nothing for the x-axis labels but a series of integers beginning with 1.

Graph #1: Determining the Parameters for the 1947-1979 Trend
The blue line shows the RGDP values that I got from FRED. The black line is the exponential trend line calculated and drawn by Excel. The red line shows my use of the trend parameters returned by Excel, to duplicate the trend line.

The red line is well hidden by the black line. That's good; it means my calculation of the trend line closely mimics Excel's calculation. I did it right.

Getting the several versions of the trend parameters from Excel requires only that I revise the start-and end-dates of the plotted RGDP values. Excel regenerates everything else for me.

When Excel draws a trend line, it is based on all the years of the source data that are shown on the graph.That's why I showed RGDP for 1947-1979 only. If I showed 1947-2012, Excel would give me a different trend line.

My purpose in duplicating Excel's trend calculation is so that I can compare the 1947-1979 trend path to the full 1947-2012 display of the RGDP data. To do that, I have to have my own calculation for the trend line values.

So far, so good.


Extending the 1947-1979 Trend


Next, I want to display RGDP for all the years given in the FRED data. I want to put an exponential trend line on the graph also. But the trend will be based on the early years, the 1947-1979 period, as shown in Graph #1. This has the best growth performance of the periods shown in Table #1.

Graph #2: RGDP and the 1947-1979 Trend Extended to 2012
As the graph shows, RGDP (blue) started falling below trend (red) around 1980.

For this graph I can show the year values across the bottom, because we already know the trend parameter values.


A Trend Comparison


I had Excel add a new trend line, based on the blue line (RGDP) for the full 1947-2012 period.

As noted above, when Excel creates a trend line, the line is based on the displayed portion of the source data.This time the trend line (black) is based on the full period, and it hugs the blue line closely until after 2007 and the crisis. The new black trend line is lower than the red trend line because RGDP growth slowed around 1980.


Graph #3: RGDP 1947-2012 (blue) and Trend (black) and the 1947-1979 Trend (red)
The black line is a smoothed measure of the growth we actually had from 1947 to 2012. The red line is a smoothed estimate of the growth we would have had if not for the slowing of growth since 1980. Real GDP would have been over 20 trillion dollars, instead of the 15 or 16 trillion that we actually saw.

But we didn't actually see the 15 or 16 trillion, because growth slowed again after 2007. You can see the blue line falling below the black trend line between 2007 and 2012, just as it fell below the red line after 1980.

This slowing of real growth below trend after 2007 created what has been called an "output gap". I have identified the output gap on Graph #4 -- below the black line, and after 2007.

Graph #4: Trend thru 1979 (red), Full Period Trend (black), RGDP (blue), and the Output Gap

Evaluating the Difference


Note that the separation between RGDP (blue) and the early trend (red) increases as time goes by. (Perhaps this is most easily seen on Graph #2.) Could this growing separation be not really a growing sluggishness but rather a mirage -- a false impression created by time and distance and old numbers getting squeezed down toward zero? After all, the red and blue lines are not only less spread apart in the early years; they are also lower on the graph. The values are less, in the early years. If the values are less and the separation is less, maybe everything stays in proportion. How can we test this?

We can take the early years of the graph and multiply the values by some constant that moves the values up to where the actual (blue and red) values are in the later years. When we magnify the small values we also magnify the small discrepancies. The differences between RGDP and trend in the early years will appear larger. Will they then appear as large as the actual discrepancies of the later years? It's worth doing a graph to find out.

Graph #5: Red and Blue Early Values Multiplied by 4 for Comparison with Late Values
I inserted some columns into the spreadsheet, to hold values that are four times RGDP of the early years, and four times the trend. These appear as the green and gold lines on the graph, above the early years of the red and blue. Note that green and gold run as high on the graph as red and blue, if not higher. The numbers are equally large. But the separation of RGDP from trend remains small in the early years.

The gold line hugs the green trend closely -- as you would expect, when the green line is based on the values shown in gold. The green line runs down the center of the variations shown by the gold. But also, there are no wide separations. In the whole of the green and gold, no separation of the lines is larger than the smallest separation of red and blue that appears in the 1980s.

So: Does everything stay in proportion? No. The separation of RGDP from trend is not dependent on the level of RGDP. The increase of separation in the late years is greater, out of proportion to the increase in the level of RGDP.


A Second Evaluation


I thought of another way to compare RGDP and trend: Look at RGDP relative to Trend. Look at the ratio. If the separation of RGDP from Trend increases in proportion as the trend increases, the ratio will run roughly flat. If the ratio is roughly flat, we will know that the separation is a mirage. But if the ratio shows that the separation is increasing, then we will know that RGDP is definitely falling behind its 1947-1979 trend.

To figure the ratio I will divide RGDP by Trend and show it as a percentage. When RGDP is precisely on trend, the graph will show 100% (meaning that RGDP is 100% of the Trend value). Where RGDP is above trend, its value will be more than 100% on the graph. And where RGDP is below trend, its value will be less than 100% on the graph.

For example, if the ratio shows a value of 102%, we know that RGDP is 2% above trend; and if the ratio shows a value of 97%, we know that RGDP is 3% below trend.

Graph #6: RGDP as a Percent of the 1947-1979 Trend
I evaluate this graph by imagining straight lines. I imagine a straight line at the 100% level from 1947 to 1975 or a little after. And I imagine a straight line starting around 1967 and downsloping so as to pass through the "center" of the wavy blue line from 1967 to 2012. The two trends I imagine don't meet at a point; they overlap from 1967 to 1975 or after. That's probably realistic: Changes in the economy are not usually instantaneous.

So we can say that RGDP clung to trend until the latter 1970s, or we can say it abandoned the trend by 1967. These are our choices. Either way, we must say that RGDP shows a significant fall from trend.


A Closer Look


There's a lot of white space on Graph #6. You could cut off everything below 60% of Trend, and everything above 110% of Trend, and still see all of the blue line. We should do that. It will allow us to fit more faint horizontal lines on the graph, to better gauge how much RGDP varies from Trend.

Graph #7: RGDP Within 5% of Trend from 1947 to 1979
In the early years, until just after 1979, RGDP is always within 5% of Trend. And the pattern is cyclical: It runs low, then high, then low, then high, then low again. The ratio hugs the 100% line. RGDP hugs the trend.

But after 1979, all bets are off. By the last years shown, RGDP falls to 70% of Trend and below. Income falls to 70% of trend, and below. If we use 1979 as the turning point, we see that the economy has been in decline for 34 years now. If we use 1967 as the turning point, the economy has been in decline for 46 years. By God, it's time to change that.

Tuesday, October 22, 2013

Let me spell it out


Market Monetarists say you can tell if money is easy or tight by how the economy is doing: Money is easy if NGDP is above trend, and money is tight if NGDP is below trend. For example, here's part of an analysis from Marcus Nunes:

Note that MP (monetary policy) was “easy” in 1998-99. That follows from the fact that NGDP was rising above trend, irrespective of the FF target rate being reduced (1998) or increased (1999)

Monetary policy was easy then, Marcus says, because NGDP was rising above trend. It has nothing to do with interest rates, he says.

What bothers me about this way of evaluating "easy" and "tight" is that it considers nothing other than NGDP and the money supply. Nothing else. Nothing matters but money, according to these guys. The pendulum has swung from the extreme that "money doesn't matter" to the extreme that money is the only thing that matters.

Hey! I'm big on money. If you want to choke off an economy, choke off the money. If you want the economy to grow, spread money around. These ideas are at the core of my thinking. But I don't reduce all of lawnmower maintenance to turning the idle screw on the carburetor a little bit one way or the other. And I don't reduce all of economic policy to tweaking the flow of money up a little or down a little. There's too much else involved, and too much at stake.


Everybody talks about the financial crisis of five years ago. Everybody focuses on that instead of on the decades-long trends that led up to it. Fine, let's talk about the crisis. What happened in the crisis is that velocity suddenly dropped like a stone:

The Velocity of Money: Still Going Down

People cut back on borrowing:

Additions to Debt: For a While, It Didn't Go Up

And people started saving more, as much as they could afford to save:

The Saving Rate: Still Trying to Go Up

People changed their behavior.

Now, you might say that if people are saving more, then we need more money to keep spending from falling. You might say that if money is moving more slowly, then we need more money to keep spending from falling. And you might even try to say that if people are borrowing less, then we need easier money to get people borrowing more, to keep spending from falling. That last one can't be right, of course. In order to say it, you have to ignore the cost of accumulated debt.

The trouble with easier money as a solution to our current problem is that it doesn't address the problem. Money isn't tight. Money only looks tight because of the changes in our spending habits since the crisis.

Come to think of it, the changes in our spending habits are a response not to the financial crisis, but to those decades-long trends that led inexorably to the crisis. Those long trends must be addressed. Actually, those long trends are being addressed. They are being reversed by our behavior since the financial crisis, as the graphs show.

Those long trends are ignored by the Market Monetarist view of what constitutes "easy" money. And these are all money-related graphs!

Here, dammit, let me spell it out. If people thought they could borrow more, and then over the next few years pay it down and come out ahead at the end, people would borrow more. But since the crisis, everybody knows you don't come out ahead at the end. So the only way to avoid getting deeper in debt is not to borrow.

Change the policies that get us always deeper in debt, and you solve this problem.

Monday, October 21, 2013

Expectations


Source: Michael Leddy

Sunday, October 20, 2013

Judging by results (at the peak of a cycle)


Found a link in my Blogger stats to a post by Gabriel Rega:

http://gabrielrega.com/2013/04/24/filtro-de-hodrick-prescott-no-excel/

The filtro-de is a dead giveaway that it's not English. But the hodrick-prescott caught my eye. So I clicked the link.

There is an intro, in Portuguese according to Google Translate. And then there's an excerpt from my De-Trending post a while back.

Sweet. So I looked around Gabriel Rega's site some, passing bits of it thru Google's universal translator. And I came across Darwins conjecture: resenha, which translates as "Darwins conjecture : review". A book review, according to Rega.

There is an excerpt, but I struggled with it even *after* translation. Something along these lines:

The quest to understand the interconnections of socioeconomic phenomena is recurrent in economic thought. But these ideas have never been the object of systematic treatment. Since Marshall in 1890, various thinkers have found biological analogy to be a shortcut to a fruitful, substantially Darwinian understanding of economic phenomena.

Not sure that's what the excerpt really says, but it interests me.

Rega's post links to Economia e Sociedade – Darwins conjecture: the search for general principles of social & economic evolution. So I go there.

No, not English. Just that bit of the post title, about "the search for general principles of social & economic evolution". The English is the title of a book by Geoffrey Hodgson and Thorbjørn Knudsen.

I Googled the title and found Geoffrey Hodgson's website and brief reviews of the book. From the first of those:

"Both Darwin’s Conjecture and From Pleasure Machines to Moral Communities present a formidable challenge to the previous assumptions of CGE [computable general equilibrium] economics, which is currently under siege on a number of fronts. These books offer a plausible, coherent alternative based on perhaps the most powerful idea of the last two centuries: evolution by natural selection.

Yeah, I'm liking this. An alternative to computable general equilibrium economics? Perhaps an alternative to Dynamic Stochastic General Equilibrium economics? Sure, I'm for that.

And you know, if you are talking about evolution of the economy and I am talking about business cycles within cycles within cycles within the cycle of civilization, then you and I are probably talking about the same thing, from different angles.

The search also turned up a 2-page PDF by Ronnie J. Phillips of the Networks Financial Institute. From the opening:

Ever since Veblen first asked the question “Why is economics not an evolutionary science?” in 1898, his followers have sought an answer to this query.

I can answer that one. It's not an evolutionary science because of first impressions. The modern study of economics began in the time of Adam Smith, at the beginning of the 150 years that Keynes called the greatest age of the inducement to invest.

For the first hundred and fifty years of economics, economists rode the rising crest of a wave: the wave of the greatest age of the inducement to invest. Everything they did, worked.  No matter what they did, it seemed to work. Things continued to improve. They assumed the success was theirs and took credit for it. And some of their ideas today are considered "laws".

Something similar happened in a much shorter time span after the end of the second World War. But things started to go bad in the 1970s and nobody knew why, so things continued to get worse. Things continue to get worse yet today. But time has passed and now people don't even know it is still the same festering problem.

Anyway, the economic environment of that age allowed economists to assume that their explanations were valid even when they were not. The result today is what we call economics.

Saturday, October 19, 2013

Parliament


It is my impression that the purpose of Parliament -- of the "speaking" -- is to control the purse strings of the King. Those who find their way to Parliament are generally men of substance; and they use the voice that Parliament gives them to limit the King's spending, to limit the taxes they must pay, and to protect their substance.

I'm sure I have this wrong, but I think the idea goes back to the Magna Carta.

One might think of the Shutdown Boys of Congress as the modern-day version of those old men of substance. One might. The question, I suppose, is whether what the "king" is spending money on is only what the king wants, or also what his subjects want.

Or maybe the better question is this: What are policymakers doing wrong, that hobbles the government's task of promoting the general welfare?


Speaking of men of substance, here's a link to a 6-minute video from utrend.tv:

http://utrend.tv/v/9-out-of-10-americans-are-completely-wrong-about-this-mind-blowing-fact/

And here's a hat tip to my son Aaron. Meanwhile, this is somehow disturbing:

Source: Google parliament etymology

Friday, October 18, 2013

Measures of Income


Graph #1: Wage and Salary Disbursements as a Percent of GDP


Graph #2: Compensation of Employees as a Percent of GDP


Graph #3: Personal Income as a Percent of GDP


Graph #: Personal Income, Compensation of Employees, Wage and Salary Disbursements Compared

// The Google Drive Spreadsheet

Thursday, October 17, 2013

Transfers


Graph #1: Total Transfers as a Share of Personal Income
A pretty consistent increase.

But how do Transfers compare to Interest and Dividend income?


Graph #2: Transfers compared to Income from Assets (Interest and Dividends)
They run close, at times.

Here's a breakdown of Transfers into component parts:


Graph #3: The Various Transfers that add up to "Transfers"
The obvious high one is Social Security (blue). Note that this has been flat since 1981.

The red and yellow, Medicare and Medicaid, don't start until 1966 but increase rapidly, and by the last years of the graph might seem to be challenging the dominance of Social Security. That's probably why some predictions see Medicare and Medicaid as more of a cost problem than Social Security.

Note also the pink one, running across the bottom of the graph, Scrooge-like.

I'm wondering if Social Security isn't really also a type of Income from Assets. Bloated these days, perhaps, but no more than financial profits in the private sector.

// The Google Drive Spreadsheet for these three graphs

Wednesday, October 16, 2013

Components of Income


As yesterday's second graph showed, even with interest and dividends added in, wages and salaries were declining since about 1970. So now I want to look at all the main categories of Personal Income:

Graph #1: The Major Components of Personal Income

1 Personal income
2 Compensation of employees, received
3 Wage and salary disbursements
4 Private industries
5 Government
6 Supplements to wages and salaries
7 Employer contributions for employee pension and insurance funds
8 Employer contributions for government social insurance
9 Proprietors' income with inventory valuation and capital consumption adjustments
10 Farm
11 Nonfarm
12 Rental income of persons with capital consumption adjustment
13 Personal income receipts on assets
14 Personal interest income
15 Personal dividend income
16 Personal current transfer receipts
17 Government social benefits to persons
18 Social security
19 Medicare
20 Medicaid
21 Unemployment insurance
22 Veterans' benefits
23 Other
24 Other current transfer receipts, from business (net)
25 Less: Contributions for government social insurance, domestic


I thought I was on to something yesterday, with interest increasing so much as a share of Personal Income. But even with interest added to wages and salaries, the total declined as a share of PI. Something else must have been increasing, enough to make up the difference.

On today's graph the green line (interest and dividends) shows a long-term increase. And so does the purple line -- transfers. I want to look at transfers next.

Tuesday, October 15, 2013

A couple quick views


On Saturday I showed interest and dividends relative to wages and salaries. It's a good comparison, but maybe it gives a false impression. Interest and dividends are not a portion of wages and salaries. (It's obvious, I know.) Anyway, interest and dividends and wages and salaries are all portions of Personal Income, and I wanted to repeat the Saturday graph, but relative to Personal Income this time:

Graph #1: Interest (blue) and Dividends (red) as a Percent of Personal Income

Looks like the Saturday graph. But the vertical axis numbers are less this time, because Personal Income is bigger than Wages and Salaries.

Here's a different view:

Graph #2: Wages and Salaries (blue) with Interest Income Added (red)
and with Interest and Dividend Income Added (orange)
The blue line trends down from about 1954; the red and orange from about 1970.

Monday, October 14, 2013

Public Wage and Private Wage


Upon considering The Government Portion of Wage and Salary Disbursements, Gene Hayward said

Is there any value at looking at the ratio of Private sector wages relative to Govt sector wages and what that graph might look like? Best I could tell by eyeballing the ratio falls into an average of 4.6 or so.

Perhaps the most succinct answer would take the "Government Portion of Wage and Salary Disbursements" graph from that post, tweak it to show the Private Sector Portion of Wage and Salary Disbursements, and let it go at that.

Graph #1: The Private Sector Portion of Wage and Salary Disbursements
But I didn't do that. I'm not very good at "succinct". I went straight to FRED, did a quick search, and found three data series to start with:

  • All Employees: Total nonfarm
  • All Employees: Government
  • All Employees: Total Private Industries

I thought: If I add Government and Total Private together and the result matches Total nonfarm on a graph, then the Government series and Private series provide a breakdown I can use. (I also found All Employees: Government: Federal. So I assume "All Employees: Government" includes more than just Federal employees.)

Graph #2: Employment: Total Govt (red), Total Private (green), and Total (blue)
Strikes me that the red line is much smoother -- much less responsive to recession than the green and the blue. Maybe that's because the red line is so much lower?

Graph #3: Like Graph #2 but with the Red Line Times 5
Multiplied the red line by five, and it's still way smoother than the others. It shows an up-jog for World War Two, an up-jog  in the mid-1960s (related to inflation or the baby boom, maybe), a down-jog with the 1980 and '82 recessions, and a down-jog with the recent recession. But it doesn't rise and fall with every business cycle. The government isn't the same as the private sector. The government isn't the same as a household.

So let me add the red and green lines from Graph #2 together and see if they add up to the blue line:

Graph #4: Red (Total Government plus Total Private) equals Blue (Total Employment)
They sure do.

So I have numbers now that I can use. Of course, they're not the private sector wages and government sector wages that Gene was talking about. They're employment numbers. But that's okay. I can take the government portion of wage and salary disbursements and divide it by the number of government employees to get a ballpark number for government sector wages. Likewise for the private sector, and I've got public and private average wage numbers to compare.

I love it when a plan comes together.


I re-created Graph #2 at FRED and downloaded the numbers. Then I deleted that download, changed the graph to show annual values, and downloaded the numbers I needed.

I put the annual employment numbers from FRED and the annual wage and salary numbers from BEA together in a Google Drive spreadsheet. Divided the private portion of wages and salaries by the private employment number, and multiplied by a million to make the units reasonable. Did the same for the government numbers. Produced this graph:


Graph #5: "Wages and Salaries" per Employee, in the Public and Private Sectors
The Google Drive Spreadsheet is available
What struck me first is how close the two lines are. Then I got wondering if my results are good. So I Googled average wage in us.

The Official Social Security Website says "The national average wage index for 2011 is 42,979.61." For 2011 the numbers on Graph #5 are $50 thousand and $54 thousand, a good deal higher than the Social Security number...

My Budget 360 reports a median household income ($50,502) which is very close to my numbers; but that is a median household number and mine is an average per employee....

The BLS Occupational Employment Statistics dated May 2012 lists an "annual mean wage" of $45,790 for "all occupations". This is the category I need to compare, but my number is 5 or 10% high...

The unreliable Huffington Post, home of illiterati, reports that "The annual median wage fell in 2010 for the second year in a row to $26,364, a 1.2 percent drop from 2009, and the lowest level since 1999, according to David Cay Johnston at Reuters." While I will never again trust the Huffington Post, I do trust David Cay Johnston. But his number is somehow skewed down to half what I came up with (perhaps by omitting salaries?) and is well below the other numbers that are lower than mine.

Finally, Wikipedia reports an average annual wage of $42,050 for the US in 2011 -- but that's disposable income; they also report a gross of $54,450. I'm right in the ballpark with that last number.

I'm sticking with my number because I can justify it, based on my source numbers. I'm going to assume that my numbers are close. If I have it wrong, let me know.


So how close are my numbers? How close to each other, I mean. The red line, average government wage, runs above the average private sector wage for all the years on the graph. But how much higher is it? I took a ratio of the two:


Graph #6:Average Government Wage relative to Average Private Sector Wage (US Data)
It's the same Google Drive Spreadsheet as Graph #5

Monster peak during World War Two. Set that aside.

There is a persistent downward trend. By my numbers, the government wage was maybe 20% higher than the private sector wage in the late '50s, early '60s. Maybe 15% higher in the late '80s, early '90s. And less than 10% higher since the War on Terrorism began. The government wage is always higher than the private wage, but by less and less as time goes by.

That reminds me of an article from the Science News Letter, from back in 1962. The article worries that declining government pay (relative to private sector pay) will harm the progress of science. I think it is safe to say that government wages have been falling, relative to private sector wages, for a long time.

I think it is safe to say the popular impression that government workers are grossly overpaid, is incorrect. As Graph #1 shows, private sector workers have been gaining on government workers since the 1970s.