Tuesday, January 31, 2012

What?


What does this mean?

The problem is that the austerity if undermining the banks and the “markets” broadly defined by reducing real GDP growth and destroying the motivation for private households and firms to expand credit within safe parameters.

From the conclusion of this post.

Now, I don't know how you would calculate this...

The quote is from Top Ten Austrian Economics Lies and Mistakes at the Recovering Austrians site.

45% of prices we pay for our daily needs are compensation for capital costs incurred by the producer.
... but that's what I'm talking about: embedded interest costs, due to the excessive reliance on credit (as measured by excessive debt).

Monday, January 30, 2012

From Krugman's "Notes on Deleveraging"


Krugman writes:

My preference is to leave financial-sector debt out of the picture, because it’s conceptually very different from nonfinancial debt. Think of it this way: compare two banking systems, one in which banks directly lend deposits out to customers, another in which many deposits are lent out through the interbank wholesale market, and then lent on to nonfinancial customers. The second system will show much higher financial-sector debt, and it is in some real sense more risky than the first, but the real economy isn’t more highly indebted than in the first case. In general, financial-sector debt is about the internal organization of intermediation, and it’s not the same kind of thing as when households or business run up a lot of debt.

In the middle of refusing to acknowledge that financial debt should be counted, Krugman says the system with more debt is in some real sense more risky.

In some real sense more risky.

So Krugman prefers not to count financial-sector debt because it's conceptually different from productive-sector debt. What, it doesn't have a cost? Of course it has a cost. And the cost of it is borne by the non-financial sector, even though it is financial-sector debt. The interest of money is always a derivative revenue.

And don't forget: When we had the crisis, it was a financial crisis.

One of the big problems with excessive debt is the threat of cascade failure: One debtor defaults, causing his creditors to default, causing their creditors to default, and before you know it the whole economic system is fallen into ruin. This was the trouble with Greece of course -- not just that Greece would go, but that Greece would take down Europe, and then Europe would take down the United States.

When you consider cascade failure, it is important to consider financial debt as part of the potential problem. For the cascade will be working its way through the financial sector on its way to the productive sector.

The fundamental problem with debt, of course, is the cost of it. Now consider one borrower, me, and one lender, you, and between us a system of financial intermediaries. Maybe there are two intermediaries in the chain; or maybe there are seven. No. Consider an economy where the financial system has grown beyond its economies of scale, so that what used to be a chain with two intermediaries now is a chain with seven. What are our options?

Either it costs me more (and you receive less interest income) because of the long chain of intermediaries who make money when I borrow a dollar from you, or I pay no more and you receive no less, but the intermediaries are squeezed.

If it costs me more and you receive less interest income, this is bad for the productive economy, bad for demand, bad for growth.

If the intermediaries are squeezed, the risk of cascade failure increases.

In the real world, our world, both things happened when debt became excessive. From the start, it was bad for growth. At the end, the financial sector was in crisis.

Sunday, January 29, 2012

Easy to See


At Broad Oak Blog, an ephemeral link in the sidebar -- Steve Keen: giving money to debtors 3x more effective than giving it to banks

Keen:

In the second half of the lecture, I use the model developed in the first half to show that money is not neutral in a credit-based economy–a higher rate of money creation results in a fall in unemployment–and also model a credit crunch. I also model two government policies to counter a crunch: giving money to the banks (which Obama did) and giving it to the debtors (which the Australian government did). Conventional money multiplier theory argues that the former is more effective; I show that the latter is about three times better than the former.

Yes.

It's very simple.

1. There's too much debt; that is the problem. So the solution is to reduce debt.
2. If you "give money to the banks" you're not reducing debt.
3. If you "give money to debtors" there's some chance they will reduce their own debt.

Quantitative easing started out as a plan to buy up toxic assets, to relieve the banks of risk. Sure, and the Federal Reserve took on that risk by taking on those assets.

But why were the assets "toxic"? Because people couldn't afford to make the payments.

The money that the Fed created from nothing to buy those assets would have been better used to pay down debts that people couldn't pay. The banks would have got the money anyway, and the toxic assets would have been destroyed.

I don't know how you would calculate a number and say it's three times better my way or Steve's way or Australia's way, than it is to do it the Fed's way. But it is easy to see which method would would better, and which method has not worked.

What is the meaning of this?


Saturday, January 28, 2012

Keywords


From Google's Webmaster Tools, the five most frequently used keywords for this blog:

Debt, money, economic, policy, growth.

I'd say they got it just right.

A little JKH paradigm riff


At Asymptosis a few days back, something wonderful from JKH:
Finally (for now), here’s a little JKH paradigm riff on the role of accounting in economics:

Consider a change in the economy between point A and point B.

The following things are true:

a) A and B as economic conditions can always be represented in accounting terms

b) Economic behaviour determines the change from A to B

c) Standard accounting identities always hold * – at A, B, every point in between, and every point before and after

d) The LEVEL of the numerical accounting variables within the identities can change from A to B, but not the identities themselves as generic accounting truths

e) BEHAVIOUR determines the change in the LEVEL at which the identities hold

f) The identities CONSTRAIN behavioral outcomes, such that c) is always true

* This assumes of course that identities are always correctly formulated, including for example various permutations around S, I, national saving, closed economies, etc.

MMT recognizes all of this, I think. It’s not necessary to be an MMTer to understand it, but it’s a big plus for their camp, IMO.

IMHO, there are two people (outside of MMT) who I always think of immediately, in terms of their understanding of the relationship between accounting and economics.

I think Paul Krugman understands it (even though he’s demonstrated occasional wobbliness in understanding the details of central bank accounting).

And I think John Maynard Keynes understood it. I think it infuses the GT, and that his ripping apart of the classics using the fallacy of composition at a general level was informed by his inherent understanding of the mathematically closed nature of double entry bookkeeping. (Sorry, that’s not such a humble observation on my part, so maybe I should attribute my own paradigm at least in part to Keynes.)

One reason I mention Krugman is that this accounting identity stuff is quite prominent in his bashing of Chicago in “Dark Age of Macroeconomics”, etc. including recently. If you read Krugman’s posts closely, he’s very careful about putting accounting in proper context, which is what this is all about. He’s very cognizant of the required logical relationship between economic behaviour and accounting.
 
The value of accounting principles to economics is in the discovery and elimination of mathematical error.

Economic behavior always determines what happens in the economy; and human nature cannot be changed.

The LEVELs of numerical accounting variables -- economic quantities -- can and do change. These levels are what concern me, always. Changes in levels can and do result in imbalances which make the economy inoperative. As a result of excessive private debt, for example, the rate of economic growth slows; and forty years of policy devices intended to boost private-sector credit use have not solved the problem.

The LEVELs must serve as a guide to policy; the purpose of policy is to guide behavior.

LEVELs above all.

Friday, January 27, 2012

Just a touch of doublespeak


From Google's new Preview: Privacy Policy

We use the information we collect ... to protect Google and our users.

Whirring the fact

Notes on the Graeber interview


I listened to the PBS interview of David Graeber repeatedly and transcribed some chunks of it.

The first Q&A, which begins around 0:45...
Q: "What were the first debts, as we understand debt today?"

A: Well
That's an interesting question
is its how moral debts -- the sense of obligation, promises (because debt is really just a promise) -- turning into something that can be quantified and transferred
and for that reason you can transfer them from one person to another
and in a way that's exactly what money is, they're debts that we can transfer.

Debt is not "just a promise". Debt is a promise to pay. Money is the payment.

Perhaps money started out as debt. I don't care.

The dining room table started out as a tree. I don't go around saying the table is a tree. That would be wrong.

The second Q&A, which begins around 1:15...
Q: When did debt become a negative?

A: It's hard to trace
It seems to go back to the very beginnings of written history
but there's always the terrible ambivalence about it
because if you look at history on the one hand
not paying your debts is the essence of immorality but
people who lend money are almost universally also considered to be evil
that's one of the mysteries I was trying to resolve
there is a sense of moral confusion about debt
it seems like in a way both parties to a transaction are at least in terrible moral peril
and probably actually both sinners and bad people.
So there is a sense that people are constantly
whirring the fact that basic economic relations causes everyone to be bad

That is interesting, both the borrowers and the lenders are "sinners". Reminds me of Benjamin Franklin's "Neither a borrower nor a lender be."

Interesting, but completely beside the point, if you want to understand the economy. Mysteries and moral confusion. To understand people maybe it is relevant.

I don't know what word "whirring" is supposed to be. Makes a good title, though.

The third Q&A, which begins around 1:52...
Q: What kind of things changed debt over time"

A: The most significant pattern that I found was
whether the predominant form of money is virtual money, is credit money, what we have now
or whether people are actually using gold, silver, bars, coins
in everyday transactions.

For most of human history virtual money -- it's nothing new -- virtual money has actually been the predominant form.

Now when people recognize that,
that money is just a promise that we make to each other
then money doesn't seem quite so ineffable
it doesn't seem quite such a moral absolute
if i owe you money
well if there's a problem, we renegotiate it...

It doesn't matter whether money is made of precious metal or paper or electronic blips. It matters if there is an extra cost associated with using it. The DPD graph shows that when that cost gets too high, we get a depression. It's very simple, really. Nothing about moral absolutes or effability.

The economy is transaction, and the problem is always cost.


Fragments, after I got tired of transcribing:

Around 3:28 she asks about the debt ceiling. Graeber calls it "a moral myth".

Around 3:43 he says: "When people start talking about debt they're not really talking about economics they're talking about morality."

Not me. When I start talking about debt, I'm talking about a cost problem. But yeah, Graeber was talking about morality at 3:28, and at 1:15.

Around 4:00 Graeber says "dollars ARE debt".

The table is a tree.

I think I just discovered what "whirring the fact" means.

Thursday, January 26, 2012

Private Debt 2012 (4b): "private-sector deleveraging"


Krugman, 22 Jan 2012, Notes on Deleveraging, links to the McKinsey Global Institute report on debt and deleveraging. The McKinsey page says

history shows that, under the right conditions, private-sector deleveraging leads to renewed economic growth and then public-sector debt reduction.

What I've been saying. In order to get the economy to grow, we must reduce private debt. Not public debt. Private debt.

The "history" to which McKinsey refers would look something like this:

Graph #1: Debt per Dollar, 1916-1990

Up until we had a Great Depression...
Down until we got a Golden Age... and
Up again, until we could bear it no longer...


Graph #2: Debt per Dollar, 1916-2010

Like that.

Oh, and yes, the public debt fell continuously all during the Golden age. And when it was low and could go no lower, there was an end of the Golden Age, and the start of troubles that continue to this day.

Graph #3: The Federal debt compared to the rest of Total Debt

And that's the way it is...

Private Debt 2012 (4): When does private debt grow?


Some things cannot be said often enough. Excessive private debt is the problem.

Last week we looked at Federal debt. We used the Federal component of total debt, where total debt was measured as FRED's Total Credit Market Debt Owed, or TCMDO.

This week we will look at all the rest of TCMDO, everything but the Federal component. And I will call it "private" debt. The red line here:

Graph #1: Total debt (blue) and Private debt (red)

I want to eliminate the blue line and just look at the red line, private debt And I want to look at the growth of that debt. So I will show "percent change" values, as I did last time to show the growth of Federal debt.

Graph #2: Percent Change from Year Ago, Private debt

Last time I highlighted the significant uptrends in government debt, and we saw that those uptrends occurred during recessions. I won't highlight the graph this time, but you can see on Graph #2 that for private debt, the downtrends generally occur during recessions. Just the opposite of the Federal debt. And the uptrends in private debt typically occur between recessions, when the economy is growing. As you would expect.

So now, I want to take the red line (total private debt) from Graph #2 and show it together with the blue line (total Federal debt) from last week's Graph #2:

Graph #3: Percent Change from Year Ago, Federal and Private debt
Wiggly lines. But if you look at the red line, it seems to be almost centered on the 10% line, dropping off perhaps toward the end. The blue line, on the other hand, has three really sharp spikes. These are associated with the recessions of 1974, 1982, and 2008.

Between those recessions, the blue line seems to be all over the place. Actually it fell a lot from 1984 to 2001 and from that low point there is another huge spike that doesn't look like a spike because it starts out from such a low point.

But before those recessions, before the 1974 recession, the blue line is quite tame. At the start, it seems to be almost centered on the zero line, maybe one or two percent, until the near-recession of 1966-67. Then a couple hefty spikes seem to push the trend upward. Even so, the blue line does not break through the red line and rise above it, until the 1974 recession.

Those sharp blue spikes of 1974 and 1982, and the premonitions in 1967 and 1970, are increases in government debt. The spikes show that our economy was already in trouble at that time. Already in trouble, in the 1970s.

But if we were already in trouble in the 1970s, then we must look for the problem in the 1950s and 1960s.

In the 1950s and early '60s, Federal debt growth was relatively slow -- averaging perhaps 2% per year. Federal debt growth was slower than GDP growth. Meanwhile, private debt was growing at a rate of 8% to 12% per year. And private debt continued to grow at that rapid rate, until accumulating debt created financial costs that led to severe recessions in the 1970s, forcing those large counter-cyclical increases in the Federal debt.

The economic problems of the 1970s and since, have their origins in the private debt growth of the 1950s and '60s.

Wednesday, January 25, 2012

Brief note


The post from 4 o'clock yesterday morning disputes the view presented in the David Graeber interview, that the Nixon decision of 15 April 1971 removed the "boundaries on the amount of money that could be printed".

The post from 4 o'clock this morning disputes the view presented in the David Graeber interview, that the Nixon decision of 15 April 1971 led to "debt spinning out of control".

Which is it? Is it printing too much money? Or is it too much debt? The interviewer, certainly, has no idea. Moreover, she has no better idea after the interview than she had before.

In order to understand the economic problem of our time, it is necessary to distinguish between money and debt.

August 15, 1971 and the "pendulum swing away from an economy based on hard currency to one based on virtual money, or credit"


Clonal recommends this interview with David Graeber, author of “Debt: The First 5,000 years”. In the intro to the interview (and in the related text) the speaker says that President Nixon, by taking us off gold,

began what anthropologist and author David Graeber says is the latest pendulum swing away from an economy based on hard currency to one based on virtual money, or credit, which can lead to debt spinning out of control...

Sounds reasonable, right?  Well, I disagree. No surprise there, I guess.

If going off gold in 1971 is the reason debt went "spinning out of control," then I think we should see a noticeable increase in debt after 1971. We should see that increase soon after 1971. And we should that increase get bigger over time, as debt gets more and more "out of control". Yeah, sort of like this:

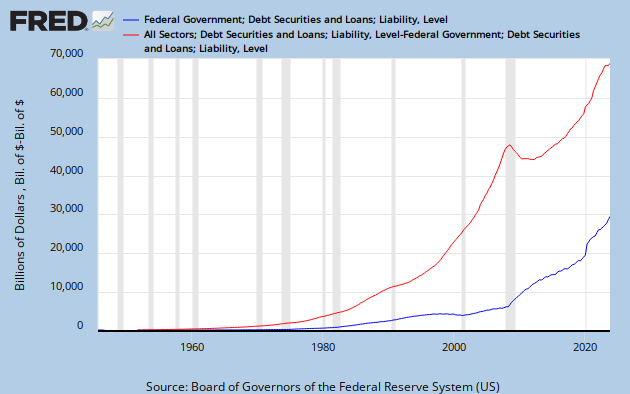
Graph #1: Total Credit Market Debt Owed

But the thing of it is, until the crisis, the blue line on Graph #1 was increasing all the time. So of course it is higher at the end than at the start. And of course it looks worse after 1971 than before. Glancing at a line that "goes up" does not provide the strength of evidence we need if we are to accept the interview statement. Not for me.

On Graph #1 I highlight what looks like a temporary increase in the general pattern of increase. This distortion of the general pattern, like the swelling from a bug bite, begins in the mid-1980s and tapers off to nothing by the mid-1990s. What I'm looking for is a change that begins the same way, but never tapers off. If debt "spins out of control" because we went off gold in 1971, there is no reason for the increase to be temporary, and every reason to expect the increase to be permanent and to grow larger.

Furthermore, the timing of the temporary increase on Graph #1 is wrong. It does not come shortly after President Nixon took us off gold. It comes shortly after President Reagan started making changes to economic policy.

Still, Graph #1, overall, does show increase that looks like an "out of control" increase in debt. Yes, I agree that it does. But again, there is the timing problem, the absence of any change associated with the Nixon policy action. I am therefore forced to reject the view presented in the Graeber interview, that the growth of debt in our lifetime is in any way a consequence of "going off gold".

To finish that thought: I think "going off gold" was a policy response to conditions that demanded action; and I think the particular "condition" demanding action was the increase in total debt that had happened before 1971. But that's just me.


Did "going off gold" create the debt problem? No.

Did going off gold make the problem worse? Yes and no. Going off gold allowed debt to continue growing and therefore allowed the debt problem to grow worse. But going off gold did not cause debt to grow worse.

As I have it, the mindset that thinks going off gold -- or any policy -- is "a good idea because it allows debt to continue growing" is the cause of the problem. That mindset has been the cause of the problem since the end of the second World War, and remains the problem today.


FRED provides TCMDO (Total Credit Market Debt Owed) numbers for every year from 1950 to 2010. Conveniently, the Nixon gold action occurred 21 years after the start-of-data. I broke up the FRED data into three periods of equal length: 1950 to 1970, 1970 to 1990, and 1990 to 2010. If going off gold was the turning point that allowed debt to "spin out of control" then we will be able to see this in the difference between debt growth before 1971, and after.

I used an old trick from Milton Friedman, and figured the debt numbers for each period relative to the period average. I think of this as making three separate graphs, for each graph finding the "center" of debt, and then stacking the graphs one on top of the other with the centers lined up. This way I can compare three 20-year increases in debt, and I am not befuddled by the fact that each subsequent increase starts where the previous increase left off.

I am looking for evidence that the Nixon gold policy of 1971 allowed debt growth to go "out of control", or that it did not. On the horizontal axis of the graph below, years are represented by the numbers "0" through "20". To figure out what those years are, add the year-number to the start date in the legend. For example, year "0" for the blue line represents 1950, for the red line 1970, and for the gold line 1990. Year "6" for the blue line represents 1956, for the red line 1976, and for the gold line 1996.

Graph #2: Comparing Three Periods of Debt Increase

The blue line on Graph #2 shows the growth of debt for the first period, 1950 to 1970. This line starts out higher than any other, and ends up lower (except for the crisis effect in year "20", when the gold (2010) falls below the blue. The blue line shows the slowest rate of increase.

The red line shows the growth of debt for the second period, 1970 to 1990. This line starts out lower than any other, and ends up higher. It shows the fastest rate of increase. So far, Graph #2 seems to support the view that the Nixon action of 1971 did result in "out of control" debt growth. But we're not done evaluating the graph!

The gold line shows the growth of debt for the third period, 1990 to 2010. This line starts out extremely close to the blue (1950-1970) line. And it stays close to the blue line for the whole period: extremely close from the "0" year (1950, 1990) to the "14" year (1964, 2004) before rising briefly and then collapsing in crisis.

The 1950-1970 period shows the slowest rate of increase. 1970-1990 shows the fastest. But then 1990-2010 shows an increase that is nearly as slow as 1950-1970. In other words, if Nixon's 1971 decision to separate money from gold had any effect at all, that effect dissipated by 1990. Given the profound significance of the Nixon decision, the effect of such an act would never dissipate, in my view. Therefore I must conclude that despite the significance of the Nixon decision, it had little consequence for the growth of debt.

Going off gold opened no floodgate. Going off gold, by itself, did not lead to debt spinning out of control.


As a point of interest, the red line starts out low because it ends up high, and because we are "centering" each 20-year period on the others. So again, this confirms that the red line -- 1970 to 1990 -- shows more of an increase than either of the other two lines.

Looking at that red line, I see a kink (an increase) around year "7" and another around year "13". These are changes in the pattern of debt increase. Year "7" on the red line is 1977, six years after the Nixon move. Year "13" is 1983, three years after the election of Ronald Reagan.

In the years before 1977, the red and blue lines appear to run parallel, red perhaps increasing slightly faster than blue, but this is not definitive. I conclude that red and blue in these years (1970-1976 and 1950-1956) show essentially the same pattern of increase. So there was no "spinning out of control" after 1971. At least, not for several years after 1971.

Did the Nixon move contribute? Did it facilitate the growth of debt? Of course. It was part of a policy dedicated to the increase of credit use and the accumulation of debt. Evidently there were other parts to that policy as well, one around 1977, and one around 1983.

Evidently it was always thought wise to use credit and to let debt accumulate:

Graph #1 repeated: Total Credit Market Debt Owed

I think the apparent strength of Graeber's argument arises from the precision of the date he chooses as a turning point: A well-defined moment. How could he be wrong?

But he *is* wrong. He is wrong because he picks one moment and says that moment defines the start of the problem. He is wrong because the moment he picks is only one of many moments, moments of policy, moments when the idea was this policy will allow debt to continue increasing, and that's good -- moments that could only lead to a very bad ending.

If there was any single turning point that opened the floodgates of debt, we would see a flood happen after that point, and no flood before. There is no such point. Debt was always increasing, as the graphs all show. It was always policy to encourage credit use and the accumulation of debt.

It is our policy -- always encouraging debt -- that is the problem. And if you bristle at the thought, let me suggest that your reaction is typical. It is this view, your view, that leads again and again and again throughout history to the crises David Graeber describes, crises that must result from a policy of perpetual debt accumulation.

Tuesday, January 24, 2012

Ke*n*


Keen:

The difficulty in developing a monetary dynamic macroeconomics comes not from the tools themselves, but from the beliefs that have to be abandoned to employ them

Keynes:

The difficulty lies, not in the new ideas, but in escaping from the old ones, which ramify, for those brought up as most of us have been, into every corner of our minds.

Almost forty years ago...


PBS: Are we slaves to debt? David Graeber on the history of spending more than we have
Almost forty years ago, on August 15, 1971 President Nixon took America off the gold standard, declaring, “We must protect the position of the American dollar as a pillar of monetary stability around the world” — which meant, among other things, that there were really no longer boundaries on the amount of money that could be printed.
 
The interview statement suggests by innuendo that if we look, we will find an unbounded increase in the quantity of money after 15 August 1971.

I will look.

Graph #1: Base Money (Log Scale)
No change related to 15 August 1971

Graph #2: M1 Money (Log Scale)
No change related to 15 August 1971

Graph #3: M2 Money (Log Scale)
No apparent change related to 15 August 1971

Graph #4: M3 Money (Log Scale)
No apparent change related to 15 August 1971

Graph #5: MZM Money (Log Scale)
No change related to 15 August 1971

Graph #6: Total Credit Market Debt Owed (Log Scale)
Possible 15-year increase following 15 August 1971

Only one of these graphs offers even a hint of increased growth, after President Nixon took America off the gold standard -- the graph of total credit market debt, or TCMDO. Of course, TCMDO is the "near money" that is furthest from money, least subject to control by the Federal Reserve, and most responsive to private sector financial decisions. TCMDO increases not by printing money but by lending it.

If you think you see a hint of post-1971 increased growth in Graph #4, let me point out that M3 is the next most distant "near money" after TCMDO. Again, it is not the money-printing that the government did, but money-lending within the private sector, which caused the change that you see.

A colorful look at the yearly change in all the monies and near-monies shown on the graphs above:

Graph #7: Percent Change from Year Ago for
the series shown in Graphs #1 through #6

All in all these trends may show a general increase from the early 1950s to the mid-1970s, followed by stabilization or downtrend to the most recent years shown. All in all, no well-defined increase following 15 August 1971.

The PBS intro's focus on printing money is the wrong focus. There was no acceleration of money-printing following President Nixon's decision of 15 August 1971. The problem is *NOT* that "there were really no longer boundaries on the amount of money that could be printed."

Monday, January 23, 2012

Karl Smith


At Modeled Behavior:

I tend to think ... that the private debt overhang is not necessarily a big deal.

Year of the Dragon

Chinese New Year, 23 Jan 2012

What I know about dragons: They are big hoarders of lethargic wealth. They live in gated communities or other hard-to-reach places.

I know that their hoards are money that is not circulating.

I know that the gold miners have to work twice as hard to produce gold to replace the gold trapped in the dragon hoards.

I know that the dragons capture most of the newly produced gold, so that the miners' work solves no problem.

I know that in good times, their hoards look to us like "the ford foundation" and "the bill and melinda gates foundation" and we think that they do good work. And they do. But their hoards interfere with circulation. The hoards make good times go bad.

I know that dragons arise as dark ages approach.


Wikipedia:

Smaug was intimately familiar with every last item within his hoard, and instantly noticed the theft of a relatively inconsequential cup by Bilbo Baggins. According to Tolkien, his rage was the kind which "is only seen when rich folk that have more than they can enjoy lose something they have long had but never before used or wanted."


Encyclopedia of psychology and religion, Volume 2
By David Adams Leeming, Kathryn Madden, Stanton Marlan
via Google Books

A couple good brief stories there, St. George and the dragon, Beowulf, more. But then the book takes these tales of hoarding and recoup, and turns them into psychobabble:

As C.G. Jung writes, "[t]he treasure which the hero fetches from the dark cavern is life: it is himself, new-born from the dark maternal cave of the unconscious..."

That's not what I'm talking about. There is no metaphor, no analogy in my description. The concept of the "dragon's hoard" applies directly to our present economic situation. And the stories of dragons convey the size and scope of the dangers that arise when the hoards absorb too much of society's wealth.


The Wealth Report, June 22, 2011:

According to the annual World Wealth Report from Merill Lynch and Capgemini, the U.S. had 3.1 million millionaires in 2010, up from 2.86 million in 2009. The latest figure tops the pre-crisis peak of three million.

David Cay Johnston of Reuters, October 19, 2011:

There were fewer jobs and they paid less last year, except at the very top where, the number of people making more than $1 million increased by 20 percent over 2009.

The median paycheck — half made more, half less — fell again in 2010, down 1.2 percent to $26,364.

CNN Money, May 9, 2011:

Despite the Great Recession, which wiped out $15.5 trillion in household wealth in the United States alone, the number of millionaires in this country and abroad will grow rapidly over the next decade.

Dragons arise as dark ages approach.


//UPDATE 23 Jan 2012: I have removed the Huffington Post quote (which said "median income fell") at the request of David Cay Johnston (who actually said the "median paycheck" fell. By email, Mr. Johnston points out that "Wages are only one component of income."

Mr. Johnston's First look at US pay data, it’s awful at Reuters is excellent.

Sunday, January 22, 2012

Never thought of this before


When people used the precious metals for money, as in ancient Rome, when savings started to accumulate in few hands there was an incentive to melt down the coin to make jewelry or ingots or whatever. And the more the money was debased, the greater the incentive, among the wealthy, to melt it down and retrieve the precious metals. This is not true of paper money.

Paper does not melt, and there is nothing precious to be retrieved by burning it. So today, when money starts to accumulate in few hands, it stays in the form of money. If you want gold you buy it, and then the seller gets the money. But the seller is not going to melt it down, either. So the money never goes away.

Therefore inflation, or debasing the money, must have an entirely different result for us than it did in ancient times.

An Artist on SOPA


This is not about 'piracy'... What this is about is control -- not of content, but of artists. Production companies don't want to have to give up that comfortable, exploitative relationship. They don't want to give up the position of power...

An interesting take on the SOPA question, from Xauri'EL Zwaan at After the Crash.

Saturday, January 21, 2012

On the Table: "About" gibberish


Causes of Economic Recession
By Kimberly Amadeo, About.com Guide
me
Economic recessions are caused by a decline in GDP growth, which is itself caused by a slowdown in manufacturing orders, falling housing prices and sales, and a drop-off in business investment. Economic recessions are not caused by declines in GDP growth. Recessions are declines in GDP growth.
The result of this slowdown is falling employment, and rising unemployment, which causes a slowdown in retail sales. This creates a downward spiral in manufacturing and increased layoffs. One is left wondering how this downward spiral ever reaches an end. From Kimberly's description, it sounds endless.
A stock market decline, known as a bear market, can either be a result of a recession but is often a cause itself. Either/or, not either/but. Just how little time did they put into this about-dot-com page, anyway?
But what usually causes the slowdown in the first place? Finally!
Each recession has its own specific causes, but all of them are usually preceded by a period of irrational exuberance. Okay...

This is also known as a business cycle.
So, the business cycle causes recessions?

Friday, January 20, 2012

"The economy" and "the economics"


Rothbard:

It should be recognized that most business-cycle theories – Keynesian, Marxist, Friedmanite, or whatever – and remedies are grounded in the assumption that the cycle stems from some deep flaw in the free-market economy.

Keynes:

If, indeed, it were true that the existing real wage is a minimum below which more labour than is now employed will not be forthcoming in any circumstances, involuntary unemployment, apart from frictional unemployment, would be non-existent. But to suppose that this is invariably the case would be absurd...

Obviously, however, if the classical theory is only applicable to the case of full employment, it is fallacious to apply it to the problems of involuntary unemployment — if there be such a thing (and who will deny it?).

Keynes points out a flaw in the theory. Not a flaw in the economy.

Rothbard is confused.

Miss Construe and the seamless web


From Rothbard:

As economic theory developed and deepened, it became obvious that there was an inherent conflict between standard "micro-economic" theory, and factual observations of the business cycle. For theory tells us that, in the market economy, there is a continuing tendency to eliminate error and to "clear the market"; there is a tendency then, for losses to be minimized. So how could there possibly be periodic clusters of severe business losses, which constitute the onset of the panic, crisis or depression? The conclusion that most economists and observers unfortunately came to was that microeconomics does not realistically apply to the "macro" level.

Rothbard recognizes the "inherent conflict between standard "micro-economic" theory, and factual observations of the business cycle." Then he says:

It should be recognized that most business-cycle theories – Keynesian, Marxist, Friedmanite, or whatever – and remedies are grounded in the assumption that the cycle stems from some deep flaw in the free-market economy. But if micro-theory is correct, then it must apply to the "macro" sphere as well. The economy is not some entity split between a micro and macro half; it is a seamless web, inextricably linked together by the use of money and the price system. Therefore, whatever applies to one part of it must apply to all. The explanation for business cycles must somehow be integrated with the explanation of the micro-economy.

Rothbard betrays his special interest by defending the free market against criticism of "some deep flaw".

But of course, the flaw is not in the economy. The flaw is in the economics. See, for example, the logic of Rothbard's economics: Assume that "micro-theory is correct," and proceed from there.

And so we see – and this is the great insight of the "Austrian" theory of the trade cycle – that micro and macro economics are in harmony after all. The free market does tend to adjust harmoniously without boom and bust, without incurring clusters of severe business losses. It is government intervention in the market that creates the business cycle, and unfortunately makes the corrective adjustment of recessions necessary.

Rothbard takes the argument where he wants it to go, rather than letting the economy point the way.

Thursday, January 19, 2012

Private Debt 2012 (3): When does government debt grow?


Some things cannot be said often enough. Excessive private debt is the problem.

I want to look at the growth of debt. I want to see when the Federal debt grows a lot, and when it doesn't.

Here's the graph we started with last week:

Graph #1: The Federal component of TCMDO debt

I want to look at the growth of debt. But first: How do we measure growth?

Wikipedia says Economic growth is measured as a percentage change in the Gross Domestic Product (GDP) or Gross National Product (GNP).

So... percentage change in the thing you are measuring. Good enough. It's the answer I expected, anyway.

So to look at the growth of Federal debt, or growth rate I guess, I want to look at the percentage change in the Federal debt. I can do that:

Graph #2: Percent Change from Year Ago, from Graph #1

Here, I took Graph #2, highlighted the significant uptrends, and used it for Graph #3:

Graph #3: Federal debt growth, with uptrends highlighted
Every highlighted uptrend but one coincides with a vertical gray bar, and every vertical gray bar except the first coincides with a highlighted uptrend.

Every significant uptrend in Federal debt growth but one coincides with recession, and every recession except the first coincides with a significant uptrend in Federal debt growth.

The one highlighted increase that does not coincide with recession occurred around 1967. There was no recession that year, but there was a near-recession in 1966-67. So while no vertical gray bar appears at that point on the graph, economic conditions were in fact recessionary, just as at every other highlighted uptrend on the graph.

The one gray-bar recession that does not coincide with a highlighted uptrend appears right at the start of the Federal debt data on Graph #3. In my view the blue-line uptrend which coincides with that recession was not significant enough to merit highlighting. Nonetheless, there is in fact an uptrend there, which coincides with the gray recession bar on the graph.


There is a strong, reliable relation between recession and Federal debt growth.

If you want to minimize the growth of Federal debt, you must minimize the occurrence, duration, and severity of recession, and you must restore health and vigor to the U.S. economy.

Wednesday, January 18, 2012

"...persuading economists to re-examine critically certain of their basic assumptions..."


Again, from the Krugman link to Understanding Eurozone debt developments by nation by Gianluca Cafiso at VOX:

Debt-to-GDP ratios started to increase in Europe in 2008. This was when governments undertook measures in an effort to avoid things getting any worse...

"Debt-to-GDP ratios started to increase ... in 2008."

Started to increase in 2008.

Oh -- and by "debt-to-GDP ratios" Cafiso means government debt. Debt to GDP ratios started going up in 2008 when governments started rescuing the financial sector. But what was the financial sector doing, I wonder? And how was the financial sector doing it for 60 years without increasing debt-to-GDP ratios??? Of course, the financial sector DID increase those ratios.

Apparently, Cafiso does not look at private debt. Private debt doesn't count, when one speaks of debt, apparently. So there was some unidentified problem in the financial sector, to which governments responded by dramatically increasing their debt. And the problem that concerns Cafiso is this government response.

This is what happens when people assume credit use is always good for growth.

Tell Congress: Don’t censor the Web


This didn't do it for me...


... but this did:


Google links to a petition you can sign.

I signed it.

The cause of the cause of the cause... of the problem


Krugman links to Understanding Eurozone debt developments by nation by Gianluca Cafiso at VOX. The paper provides a bit of history:

Debt-to-GDP ratios started to increase in Europe in 2008. This was when governments undertook measures in an effort to avoid things getting any worse – they put in place stimulus packages and rescued large financial institutions.

"Debt-to-GDP ratios started to increase ... when governments ... rescued large financial institutions."

So now, what was the cause of the problem? Not the government debt. Government debt is the result of the problem. The problem was the private debt that grew to its breaking point.

The problem was that private debt was allowed encouraged to grow to its breaking point.

The problem was the policy that encouraged growth of private debt.

The problem was the thinking that created that policy.

The problem was the flawed assumptions underlying that thinking: the assumption that credit-use is good for growth; and the assumption that if there is inflation it must be due to printing money and cannot be due to credit-use.

I cannot trace the problem back beyond this point.

Tuesday, January 17, 2012

Are EU listening?


From Bloomberg:

Sweden Shows Europe How to Cut Debt, Weather the Recession: View
By the Editors: Jan 4, 2012

Sweden faces a difficult year, like every other European economy, but unlike the rest of the European Union, it’s equipped to cope. There are lessons here...

Shortly before Christmas, the Riksbank cut its benchmark rate for the first time since 2009 to 1.75 percent. The NIER predicts further reductions this year in response to a weaker economy and slower inflation. This prospect underscores the seriousness of the situation -- and how valuable it is at such times to have an interest rate to change.

The value of monetary independence is the first and most important Swedish lesson.

Gosh golly gee. When the economy takes a baseball bat to your head, suddenly you can see the there are problems with the whole European Union thing. Gosh golly me.

Please note that every news article that brushed up against the EU on the way to its creation made a point of saying the union would improve economic conditions.

Monday, January 16, 2012

Personal Bankruptcies


Going through comments of the last couple months. There are several I would like to follow up on. Here's one that required only a Google search.

On mine of 18 November 2011, Jazzbumpa quoted me

It is possible to assert that no individual owes more debt than he can afford

and responded

But it is not possible for that assertion to be correct, or there would be very few personal bankruptcies.

I was not making the assertion, of course. I was assessing a trend. Anyway, it struck me to look at personal bankruptcies. Didn't find anything at FRED. But I did find this graph from BankruptcyAction:


Pretty good increase since the mid-1980s. And a suspicious-looking fall in personal bankruptcies around 2006.

And I did find these remarks from Smart Debt Repair:

Bankruptcy Law Change

In 2005 the U.S. Government passed legislation that made it more difficult for the average person to file for bankruptcy. This came at a point when the number of Chapter 7 bankruptcy filings were skyrocketing.

The law changes have meant that it is now compulsory for anyone attempting to file for bankruptcy to first undergo credit counselling. The government also attempted to stem the tide of Chapter 7 filings by creating new restrictions on who can file under Chapter 7 based on income.

Essentially, if your monthly income is greater than the median income for your state and you can pay $100 or more towards your debt each month, you have an obligation to file under Chapter 13.

The theory behind this change was to force more people to take action that would let them keep their homes, reducing other relevant social problems. All this doesn’t seem to have worked very well when one considers the state of the housing market and general economy in the U.S. and world today.

Sunday, January 15, 2012

Alexander Hamilton's "National Bank"


The St. Louis Fed offers FRASER, a "digital library of historic economic and banking publications and archival material". I went to The First and Second Banks of the United States, clicked Browse All Available Text, and selected this PDF:

National bank
Date: December 13, 1790
Authors: Hamilton, Alexander, 1757-1804

Citation:
Hamilton, Alexander, 1757-1804, 1790, National bank, from The First and Second Banks of the United States, accessed Dec 25, 2011 from FRASER, http://fraser.stlouisfed.org/docs/bankunitedstates/asp_v1_018.pdf

Well, aren't you in for a treat!


The "he" in the following excerpt is Hamilton:
Previously to entering upon the detail of this plan, he entreats the indulgence of the House towards some preliminary reflections naturally arising out of the subject, which he hopes will be deeded neither useless nor out of place. Public opinion being the ultimate arbiter of every measure of government, it can scarcely appear improper, in deference to that, to accompany the origination of any new proposition with explanations, which the superior information of those to whom it is immediately addressed, would render superfluous.

What a suck-up!

The following are among the principal advantages of a Bank:

First: The augmentation of the active or productive capital of a country. Gold and silver, when they are employed merely as the instruments of exchange and alienation, have been not improperly denominated dead stock; but when deposited in banks, to become the basis of a paper circulation, which takes their character and place, as the signs or representatives of value, they then acquire life, or, in other words, an active and productive quality...

It is a well established fact, that banks in good credit, can circulate a far greater sum than the actual quantum of their capital in gold and silver. The extent of the possible excess seems indeterminate; though it has been conjecturally stated at the proportions of two and three to one.

A quantity of money that is two or three times the quantity of gold and silver coin. Imagine that!

When Adam Smith wrote of it, some 24 years earlier, he estimated a quantity of paper money equal to the quantity of gold and silver coin:
When paper is substituted in the room of gold and silver money, the quantity of the materials, tools, and maintenance, which the whole circulating capital can supply, may be increased by the whole value of gold and silver which used to be employed in purchasing them. The whole value of the great wheel of circulation and distribution, is added to the goods which are circulated and distributed by means of it.
(Adam Smith, The Wealth of Nations, Book 2, Chapter 2)

All of that paper -- an amount equal to, or perhaps two or three times the total value of the coin of the realm -- is somebody's debt. Or more accurately, that paper was created when people took on debt.

Hamilton imagined a quantity of debt that was two or three times the quantity of gold and silver coin. Today we do not use gold and silver coin, so we cannot make that comparison. But at the peak in 2007, we had a quantity of debt that was 35 times the quantity of M1 money in circulation -- the money we receive as income.

Saturday, January 14, 2012

What is financial debt?


Financial debt is the debt that is needed to permit the growth of debt of the productive sector. Think of it as an underlying cost.

Graph #1 shows financial debt as a percent of total (public and private) debt:

Graph #1: Financial Debt as a percent of Total Debt
From less than 5% of debt in 1960, financial debt increased to more than 30% of total debt in the new millennium. That is a big increase in the underlying cost of the debt carried by the productive sector.

And if we judge by the way the uptrend stopped short after the 2001 recession, it looks like that increase was unsustainable.

How can that be?

This is how:

Graph #2: Financial Debt as a percent of Productive Debt

Financial debt rose until it was almost half as much as all the non-financial debt counted in total (TCMDO) debt. Almost half. That means that for every dollar of interest some poor sucker might have been paying on his own debt, he was paying almost 50 cents more for the underlying debt of the lenders who lent him that money.

Excessive reliance on credit is unsustainable policy.

Friday, January 13, 2012

Stories


"And I had little difficulty in determining the objects with which it was necessary to commence, for I was already persuaded that it must be with the simplest and easiest to know..." -- Descartes


PeterC at Heteconomist, 18 December 2011:

The main insight of Polanyi that I emphasized previously is that throughout history money had long been recognized as a social relation, or more specifically a debt relation, but that with the industrial revolution there was an attempt through the gold standard to tie money more closely to the market economy by making it a ‘commodity’.

I have trouble understanding the concept of money as a social relation. I can understand the economy as a set of social relations, as transactions: work done or value provided in exchange for money now or in the future. But the social relation "value exchanged for money" is by no means identical to the "money thing".

So I tend to think Peter's story is a load of crap. But I'm trying to understand, so I go back to his previous post.

Heteconomist, 17 December 2011:

The first thing that caught my attention was a passage from The Great Transformation. On page 71, Polanyi argues that in all social systems prior to the industrial revolution, “the economic order is merely a function of the social, in which it is contained”.

???

These are big concepts, the economic order and the social order, and the containment of order by order. I don't really know what those concepts mean, nor what Peter thinks Polanyi means. But the concepts are certainly big, general concepts. Peter's post sure sounds important.


"Prior to the industrial revolution." When was that? Let's say, before 1760. So what was the economy like, in the centuries before 1760?


Based on numbers from MeasuringWorth, there really was not much of an "economic order" at all, before 1760. No wonder the social order was dominant.


Do you suppose Polanyi included ancient Rome and Greece and Egypt and Babylon and stuff, in with "all social systems" "throughout history" up to 1760? I cannot say, but I doubt it. If I am wrong, let me know.

Meanwhile, suppose we consider civilization after the fall of Rome.

Peter and Polanyi say that throughout history (until the Industrial Revolution) money had been "recognized as a social relation, or more specifically a debt relation". Peter calls money a "fictitious commodit[y]". Let me provide some background to contradict that small piece of the Heteconomist post.

Regarding the early years after the fall, Carlo M. Cipolla writes:

Money, Prices, and Civilization in the Mediterranean World, Fifth to Seventeenth Centuries, by Carlo M. Cipolla. Gordian Press, Inc. New York, 1967. (C) 1956 by Princeton University Press
As a matter of fact, since the beginning of the fifth century Mediterranean Europe, like the rest of Western Europe, had fallen into a stage of economic life near that of primitive societies.... [p.3]

The general impression is that any commodity was considered a potential means of exchange, and coins were considered just like any other commodity, one among hundreds of possible means of exchange, sometimes particularly desired and sometimes not. [p.6]

...the very notion of money ...[in the examples given] was the primitive notion of a standard of weight. [p.7]

[This is] indicative enough of the direction in which the system of payments was moving. [p.7]

This vagueness in the notion of money when it was used as a standard of value was another step from the stage of 'monetary' economy in the direction of a 'barter' economy.[p.7]

Vagueness in the notion of money went hand-in-hand with the decline of society, according to the historian Cipolla. But money and society were two different things. Money was a "commodity". It was not a "relation".

With the beginning of modern times the social implications of the petty coins were completely changed. Through a progressive secular debasement the small coins were now reduced to very low units of value. On the other side, through the sixteenth century, the general level of prices and wages moved markedly upward. Consequently, during the sixteenth century it became more and more common to see gold scudi or gold ducati or big silver ducatoni in the hands of the wage-earning people, just as it became more and more common to see these pieces used as means of payment in local and petty transactions.

The gold coins lost the character of 'aristocratic money.' Their 'democratization' was indicative of the direction in which the times were moving. [pp.36-37.]

It is quite clear that money was not a "relation" at all, but rather a "thing" that was, and is, used for the storage and exchange of value.


Another writer offers a similar view. In The Wealth of Nations, Adam Smith wrote:

The northern nations who established themselves upon the ruins of the Roman empire, seem to have had silver money from the first beginning of their settlements, and not to have known either gold or copper coins for several ages thereafter. There were silver coins in England in the time of the Saxons; but there was little gold coined till the time of Edward III nor any copper till that of James I. of Great Britain. In England, therefore, and for the same reason, I believe, in all other modern nations of Europe, all accounts are kept, and the value of all goods and of all estates is generally computed, in silver: and when we mean to express the amount of a person's fortune, we seldom mention the number of guineas, but the number of pounds sterling which we suppose would be given for it.

The money was silver, according to Adam Smith. It was not a relation, whatever that may be supposed to mean.


But you will think what you want to think, regardless of what I say. I'm just saying, I don't like it when people make up stories to suit their worldview. And maybe it's just me, but when those stories are incomprehensible, they ought to be rejected outright.

Money is not a "social relation". Money is a "thing". Money was not "made into a commodity" by the gold standard. Money was always a commodity. If we refuse to accept such simple fundamentals, how can we ever hope to fix the economy?

Never overlook a lack of clearness and of generality in the premisses.

Thursday, January 12, 2012

Private Debt 2012 (2): Does Size Matter?

Some things cannot be said often enough. Excessive private debt is the problem.

Suppose we look at the part of the Federal debt that is counted in Total Credit Market Debt Owed...

Graph #1: The Federal component of TCMDO

Yup, goes up. It's not the big one, though. Here's how that Federal debt -- the blue line -- compares to everybody else's debt...

Graph #2: The Federal component, and the rest of TCMDO

The red line, private debt, our debt makes public debt look small by comparison.

I'm not saying the Federal debt is small. I'm saying private debt is really big.

But Graph #2 does not show us much, apart from raw numbers. I want to compare the two debts mathematically. Simple division. The Federal debt divided by the rest of the debt. I want to see what happened.

Graph #3: The Federal component divided by the rest of TCMDO

Graph #3 compares the Federal debt to Private debt. It shows the blue line from Graph #2, divided by the red line from Graph #2.

Basically, the Federal debt does not look any bigger now than it was in 1970, when you compare it to everybody else's debt. But of course the Federal debt is bigger now. That's the point.

Everybody's debt is bigger now.

Wednesday, January 11, 2012

The King's Treasure


When the money of a country is issued from the treasury of a king, the riches of the nation grow on the king's schedule.

As the king's treasury empties, treasure accumulates among his people. There comes a time when the king has expenses he cannot meet, and the wealthiest of his subjects come to him with a plan to create a bank that will lend the king money.

Eventually, the king's treasury holds so little, and his people hold so much, that the concept of "a king and his country" changes to "a nation". And the wealth of nations is no longer thought to be in the king's treasury, but in the busyness of his subjects.

The king gives up his treasure; his creditors lend theirs at interest. Both methods increase the wealth of the people. The one comes at a cost to the treasury; the other at a cost to the people.

There comes a time when the king can no longer freely dispense wealth from his treasury; at this point the money of the nation can no longer be backed by the king's treasure.

There comes a time when so little of the people's money comes from the king, and so much from the banks, that the cost of money becomes an obstacle to the progress of wealth.


The source of my understanding, the DPD graph, informs me that we must maintain a balance between the king's money and the bank's issue. The story above suggests that the cost of money -- the factor cost of money -- is the primary problem.

You might disagree, saying the problem is concentration of wealth. Yes, this is part of the imbalance today; there is no reason for us to disagree. Financial wealth, lent out at interest, is the bank issue that creates the cost that is our problem.

Still, the same problem could arise even if wealth were equally distributed. Financial wealth is "wealth" because it generates income. The income it generates is, for society as a whole, the factor cost of money -- a cost that competes with income arising from productive activity.

The problem is the cost that arises from excessive reliance on bank issue. It turns out, this time, that concentration of wealth leads this cost to become concentrated income for the wealthy. As far as I know, it turns out every time that way. But the problem is not the concentration; the problem is the cost.

I point out a cost that competes with wages and prices, interferes with the vigor of economic growth, and applies continuous upward pressure to prices.